A Pine Script tool for calculating Nikkei Average target prices by multiplying EPS with different Price-to-Earnings Ratio multiples, providing multiple potential price scenarios.
Explore complementary indicator rolesHow it works
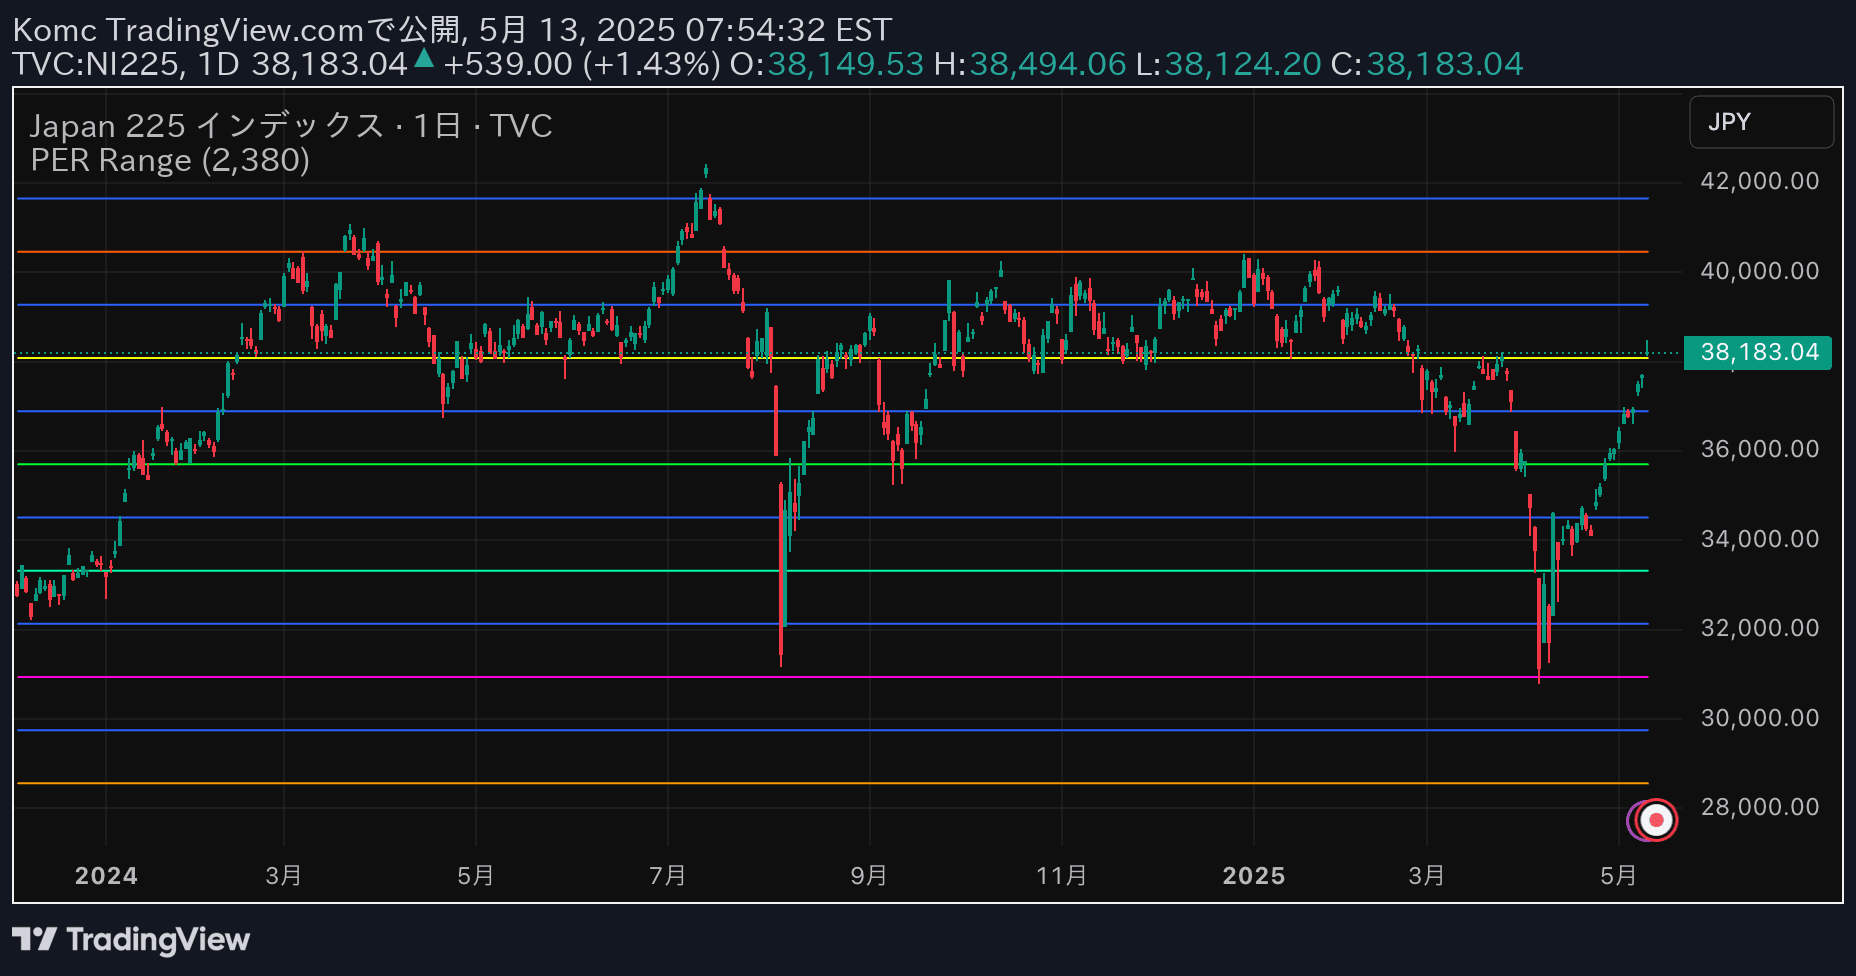
The script uses a fundamental analysis approach by calculating target prices through the EPS and PER method. It starts with a predefined Earnings Per Share (EPS) value and multiplies it by various Price-to-Earnings Ratio (PER) multiples ranging from 17.5x to 12x in 0.5x increments.
By systematically generating these target prices, the script creates a visual representation of potential market valuations. The calculated prices are plotted as blue lines on the chart, allowing traders to see different pricing scenarios based on changing PER multiples.
Why it may be useful
Fundamental analysis is crucial for understanding the intrinsic value of market indices like the Nikkei Average. By providing multiple target price scenarios, this script helps traders and investors assess potential market movements based on earnings and valuation metrics. It offers a structured approach to estimating future price ranges.
The flexibility of adjusting EPS and exploring different PER multiples enables more nuanced market analysis. Traders can use these insights to make more informed decisions about potential entry and exit points, understanding how earnings and market sentiment might influence price levels.
When to explore it
This target price calculation method is most effective during periods of stable earnings and predictable market conditions. It works best when used as a complementary tool alongside technical analysis, providing a fundamental perspective on potential price movements. Investors can leverage this approach during earnings seasons or when significant economic reports are expected.
The script is particularly useful for swing traders and long-term investors who are interested in understanding broader market valuation trends. It can help in setting potential price targets, managing risk, and developing a more comprehensive view of market dynamics beyond short-term price fluctuations.
Keep exploring
What we’ve verified
Access, alerts and repainting behaviour have not been independently verified for this indicator. Check the creator’s current publication and settings.
General descriptions and classifications are recovered research. Verified details above identify the specific checks we have completed. Check the creator’s current publication for later changes.