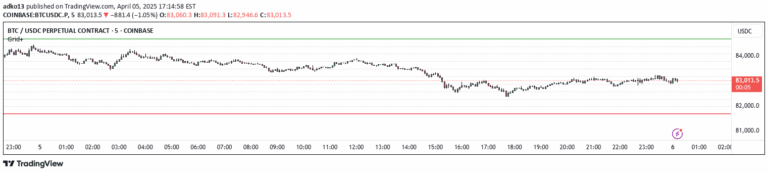
A technical analysis tool that identifies price ranges, calculates volume distribution, and detects potential consolidation zones with point of control analysis.
Explore complementary indicator rolesHow it works
The system identifies price ranges by examining pivot points and extremes in the market, carefully confirming their relevance through a multi-step verification process. It checks for specific conditions and filters to ensure the range meets predefined criteria, using a built-in pivot point feature that requires confirmation from bars to the left and right of an identified point.
Once a valid range is established, the indicator calculates volume distribution and determines the Point of Control (POC), which represents the price level with the highest traded volume. The system uses configurable settings like left and right bar parameters, range logic, and wick considerations to create a comprehensive analysis of market structure and potential consolidation zones.
Why it may be useful
This indicator provides traders with a sophisticated method of understanding market dynamics by revealing hidden volume information and potential price consolidation areas. By identifying where the most significant trading activity occurs, traders can gain insights into market sentiment and potential future price movements.
The system's ability to filter ranges and detect breakouts helps traders make more informed decisions by eliminating volatile or irrelevant price zones. Its visual customization options and alert system further enhance trading strategies by providing clear, actionable information about market structure and potential entry or exit points.
When to explore it
The range detection tool is most effective in markets experiencing consolidation or preparing for potential trend reversals, where understanding volume distribution can provide critical trading insights. It works particularly well in markets with clear price ranges and significant volume activity, helping traders identify potential breakout or reversal points.
Traders should utilize this indicator when seeking to understand market structure, confirm potential trend changes, and develop more precise entry and exit strategies. It is especially useful in volatile markets where understanding volume concentration can help filter out false signals and provide a more nuanced view of market dynamics.
Keep exploring
What we’ve verified
Access, alerts and repainting behaviour have not been independently verified for this indicator. Check the creator’s current publication and settings.
General descriptions and classifications are recovered research. Verified details above identify the specific checks we have completed. Check the creator’s current publication for later changes.