
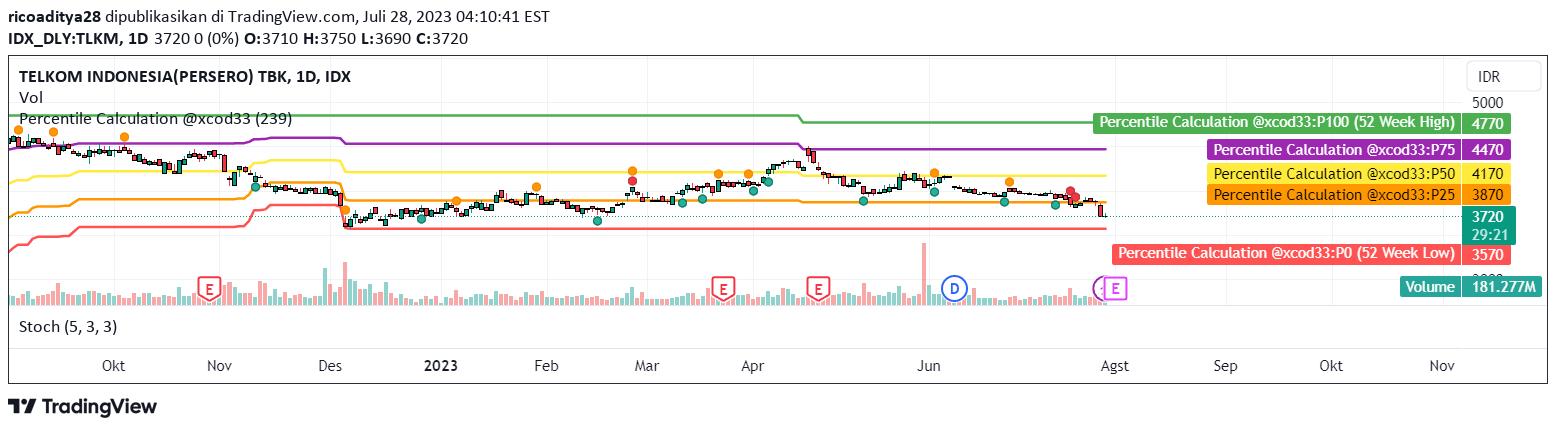
A price percentile indicator that reveals the current price position within the 52-week high and low range, offering insights into price extremes and market conditions.
Explore complementary indicator rolesHow it works
The script calculates the current price percentile by comparing the present price to the highest and lowest prices recorded over the past 52 weeks. It determines the relative position of the current price within this historical range, expressing the result as a percentage between 0% and 100%.
When the percentile approaches 0%, it indicates the price is near the lowest point in the 52-week range, while a percentile close to 100% suggests the price is near its highest point. A percentile around 50% implies the price is hovering around the midpoint of its historical range.
Why it may be useful
This indicator provides traders with a quick snapshot of price positioning relative to recent market history, helping to contextualize current price movements. By understanding where the current price sits within its recent range, traders can gain insights into potential market sentiment and price momentum.
The percentile helps identify potential breakout opportunities, consolidation periods, and price extremes. It offers a simple yet powerful way to assess whether a financial instrument is trading near its historical highs, lows, or in a stable middle range, which can inform trading decisions and risk management strategies.
When to explore it
The price percentile indicator is most effective when used in conjunction with other technical analysis tools and market research. It works best in markets with clear trending or ranging characteristics, where historical price ranges provide meaningful context for current price action.
Traders should consider using this indicator during periods of potential trend changes, when looking to identify potential entry or exit points, or when assessing the overall market context. It is particularly useful for understanding price positioning in stocks, forex, indices, and commodities, but should not be relied upon as the sole basis for trading decisions.
Keep exploring
What we’ve verified
Access, alerts and repainting behaviour have not been independently verified for this indicator. Check the creator’s current publication and settings.
General descriptions and classifications are recovered research. Verified details above identify the specific checks we have completed. Check the creator’s current publication for later changes.


