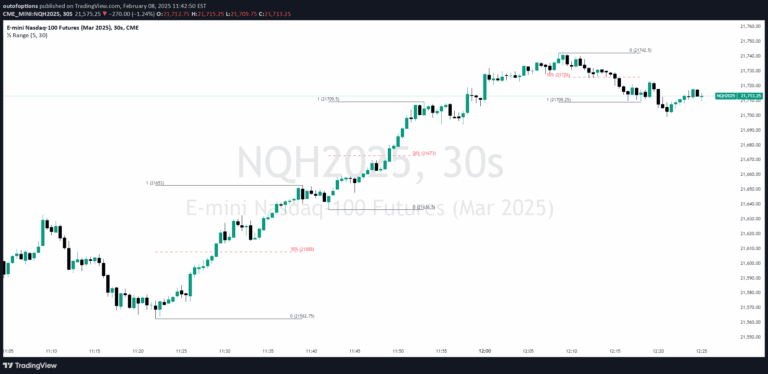
A trading indicator that plots percentage-based support and resistance levels using the previous day's closing price, helping traders identify potential entry and exit points.
Explore complementary indicator rolesHow it works
The indicator calculates four key percentage levels around the previous day's closing price: +0.25%, +0.50%, -0.25%, and -0.50%. These levels are derived by applying fixed percentage increments above and below the closing price, creating a symmetrical framework of potential support and resistance zones.
By using the previous day's closing price as a reference point, the script generates horizontal lines on the chart that visually represent these percentage levels. Green lines are plotted for positive percentages above the close, while red lines indicate negative percentages below the close, providing traders with a clear and intuitive visual representation of potential price movement boundaries.
Why it may be useful
Percentage-based levels offer traders a systematic approach to identifying potential price reversal or continuation points without relying on complex mathematical calculations. These levels provide a simple yet effective method for understanding potential market movement, helping traders make more informed decisions about entry, exit, and risk management.
By presenting these levels visually on the chart, the indicator allows traders to quickly assess potential support and resistance zones. The color-coded lines and percentage labels make it easy to interpret the levels at a glance, enhancing traders' ability to recognize and react to potential price movements more efficiently.
When to explore it
This indicator is most effective in markets with moderate volatility, where price movements are likely to respect percentage-based levels. It works particularly well for traders who prefer a straightforward, rule-based approach to identifying potential trading opportunities without complex technical analysis.
The percentage-based levels are especially useful during trending markets or when price is consolidating within a specific range. Traders can use these levels to set initial stop-loss orders, take-profit targets, or as potential entry points when price approaches or bounces off these predefined percentage zones.
Keep exploring
What we’ve verified
Access, alerts and repainting behaviour have not been independently verified for this indicator. Check the creator’s current publication and settings.
General descriptions and classifications are recovered research. Verified details above identify the specific checks we have completed. Check the creator’s current publication for later changes.