World Digital Clock
A real-time digital clock and market status indicator tracking global financial markets, showing open/closed status and time zones for Tokyo, London, New York, and Frankfurt.
Explore 11,183 indicators. Filter beyond the obvious.
Discover the tools that fit the way you trade.
11,183 tools to explore
A real-time digital clock and market status indicator tracking global financial markets, showing open/closed status and time zones for Tokyo, London, New York, and Frankfurt.
A real-time market aggression indicator that analyzes trading pressure through a thermometer, percentage panel, and cumulative times & sales bar to identify buyer and seller dominance.
A daily high and low tracking indicator that automatically plots green and red horizontal lines to mark the current trading session's extreme price levels in real-time.
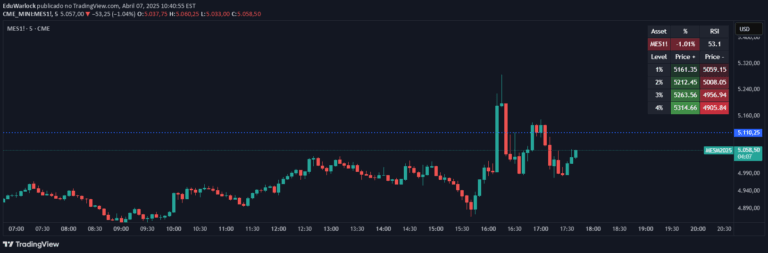
A trading indicator that plots percentage-based support and resistance levels using the previous day's closing price, helping traders identify potential entry and exit points.
A real-time performance visualization for the top 7 NASDAQ stocks, displaying daily percentage changes with color-coded trend indicators for quick market sentiment analysis.
Price Guide NQ is a daily trading indicator that plots 30 horizontal guide lines above and below the Nasdaq index's opening price, helping traders identify key psychological price levels.
A dynamic volatility indicator that calculates price range and provides adaptive stop-loss levels based on recent market movement, helping traders manage risk more precisely.
Tcloud Future is a trend-based indicator creating a forward-projected cloud using EMA and McGinley Dynamic averages to visualize potential market direction and momentum.
A dynamic table that calculates and visualizes daily percentage-based price ranges, providing traders with quick insights into potential market movement and volatility zones.
Likes, views, and comments are historical TradingView snapshots. They describe attention, not trading performance.