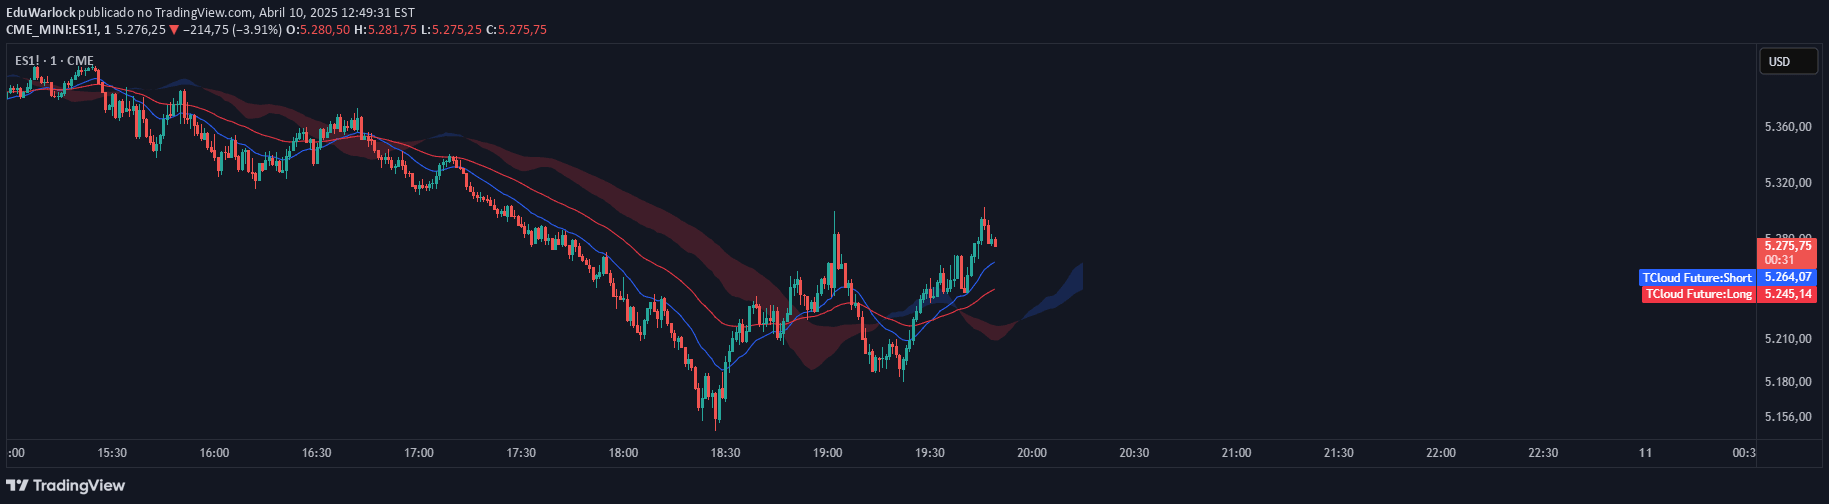
Tcloud Future is a trend-based indicator creating a forward-projected cloud using EMA and McGinley Dynamic averages to visualize potential market direction and momentum.
Explore complementary indicator rolesHow it works
The Tcloud Future indicator combines two moving averages: a 19-period Exponential Moving Average (EMA) and a 26-period McGinley Dynamic average. These averages create a cloud projection that is shifted 26 candles into the future, providing a visual representation of potential trend direction.
The cloud changes color based on the relative positions of the two moving averages: green when the EMA is above the McGinley average (bullish), and red when the EMA is below (bearish). This color-coded approach helps traders quickly identify the current market momentum and potential trend shifts.
Why it may be useful
The Tcloud Future indicator offers traders a dynamic and forward-looking view of market trends, helping them anticipate potential price movements before they occur. By projecting a cloud into the future, it provides a unique perspective on potential trend continuation or reversal, giving traders a strategic advantage in market analysis.
The combination of EMA and McGinley Dynamic averages creates a more adaptive and responsive trend indicator compared to traditional moving average methods. This approach helps traders better navigate changing market conditions and make more informed trading decisions.
When to explore it
The Tcloud Future indicator is most effective in trending markets with clear directional movement, performing best when prices are consistently moving up or down. Traders should use this indicator in conjunction with other technical analysis tools to confirm signals and reduce false positives.
It is particularly useful for identifying trend entries, support and resistance zones, and potential trend reversals. However, traders should exercise caution in sideways or choppy markets where trend signals may be less reliable and require additional confirmation.
Keep exploring
What we’ve verified
Access, alerts and repainting behaviour have not been independently verified for this indicator. Check the creator’s current publication and settings.
General descriptions and classifications are recovered research. Verified details above identify the specific checks we have completed. Check the creator’s current publication for later changes.