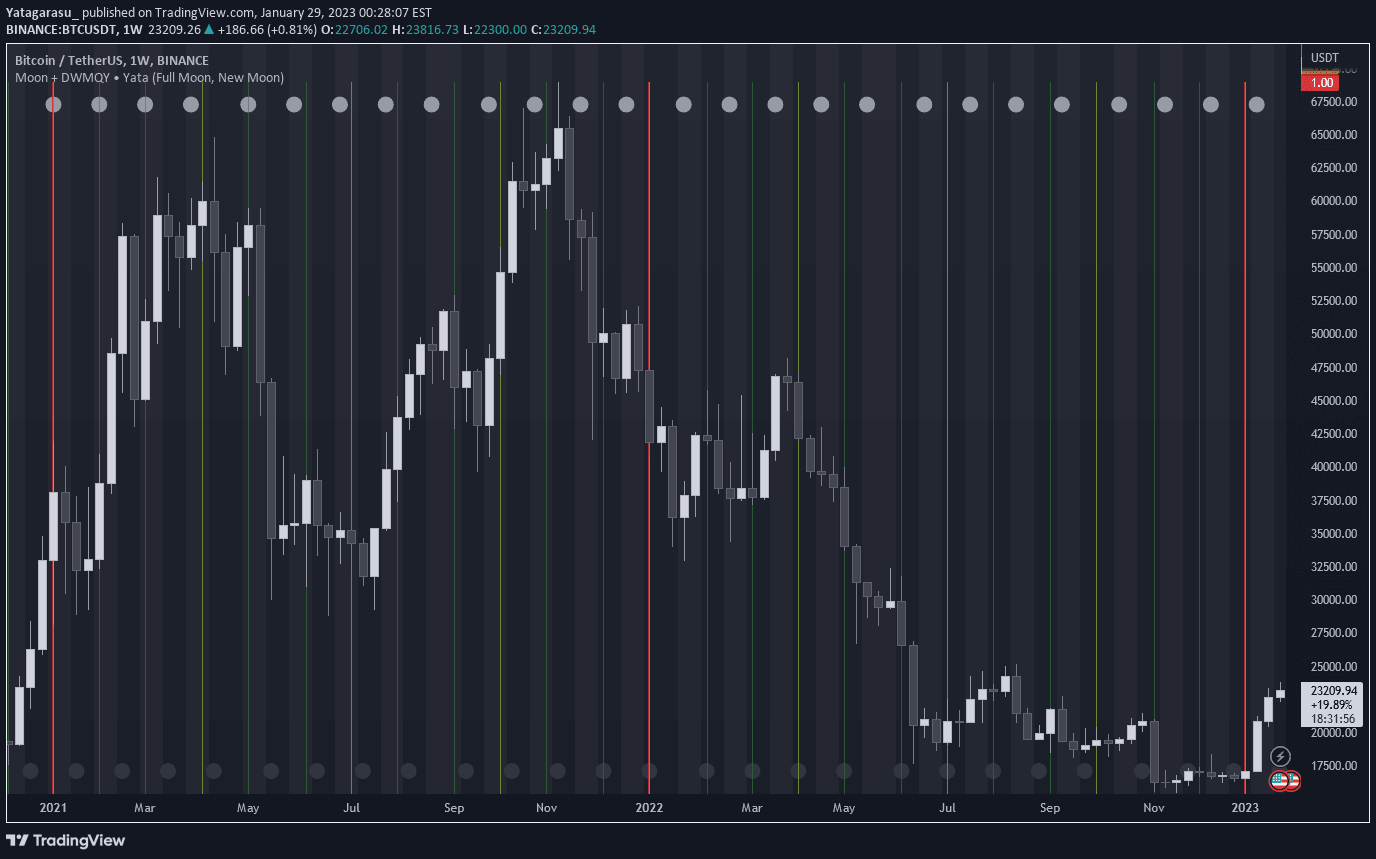
A simple forex market indicator using vertical lines to mark London session opening and weekly Asian session closing, helping traders analyze market dynamics across different timeframes.
Explore complementary indicator rolesHow it works
The indicator creates two types of vertical lines on a trading chart: thin lines representing the London session opening and thick lines signaling the end of the weekly Asian session. These lines provide visual markers that help traders quickly identify key market transition points and session boundaries.
By plotting these lines across different timeframes like 5-minute or 10-minute charts, traders can maintain a clear view of daily market openings and closings. The lines serve as reference points that help traders understand market structure and potential price movement zones.
Why it may be useful
This indicator simplifies chart analysis by providing clear visual references for important market sessions and transitions. Traders can use these lines to quickly identify potential liquidity zones and understand the broader market context without complex technical analysis.
By marking previous days' highs and lows, the indicator helps traders recognize critical price levels and potential areas of market interest. This can enhance decision-making by providing quick insights into market structure and potential trading opportunities.
When to explore it
The indicator is most effective for forex traders focusing on intraday and short-term trading strategies. It works best in highly liquid currency markets where session transitions can create significant price movements and trading opportunities.
Traders should use this indicator in conjunction with other technical analysis tools and personal trading strategies. It is particularly useful for those who want to understand market dynamics across different timeframes while maintaining a simple and clean chart view.
Keep exploring
What we’ve verified
Access, alerts and repainting behaviour have not been independently verified for this indicator. Check the creator’s current publication and settings.
General descriptions and classifications are recovered research. Verified details above identify the specific checks we have completed. Check the creator’s current publication for later changes.