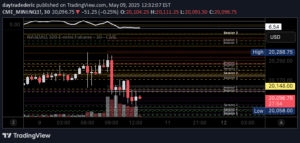
A comprehensive pivot point indicator that identifies support and resistance levels across multiple timeframes, helping traders understand potential price reversals and breakout opportunities.
Explore complementary indicator rolesHow it works
The Perfect Pivot Range (PPR) indicator calculates pivot points dynamically using real-time price data across daily, weekly, and monthly timeframes. It generates key support and resistance levels by analyzing previous period highs and lows, creating a comprehensive framework for understanding potential price movements.
Traders can customize the indicator to display specific pivot levels and historical high-low zones, allowing for flexible analysis. The system automatically computes pivot points (PP), support levels (S1, S2), and resistance levels (R1, R2), presenting a multi-dimensional view of potential price interaction zones.
Why it may be useful
The PPR indicator provides traders with a structured approach to identifying critical price levels, reducing guesswork in technical analysis. By offering pivot points across multiple timeframes, it helps traders understand both short-term and long-term market dynamics, enabling more informed trading decisions.
This tool is particularly valuable because it transforms complex price data into clear, actionable insights. Traders can quickly visualize potential support and resistance zones, making it easier to plan entries, exits, and stop-loss levels across different markets and trading styles.
When to explore it
The PPR indicator is most effective in markets with clear trending behavior, such as stocks, commodities, and options. It works best when price is showing consistent movement and respecting established support and resistance levels, providing traders with reliable entry and exit points.
Traders should utilize the PPR during periods of market volatility and when seeking to confirm trend strength or potential reversals. It is particularly useful when combined with other technical indicators, offering a comprehensive view of market conditions and enhancing overall trading strategy.
Keep exploring
What we’ve verified
Access, alerts and repainting behaviour have not been independently verified for this indicator. Check the creator’s current publication and settings.
General descriptions and classifications are recovered research. Verified details above identify the specific checks we have completed. Check the creator’s current publication for later changes.