
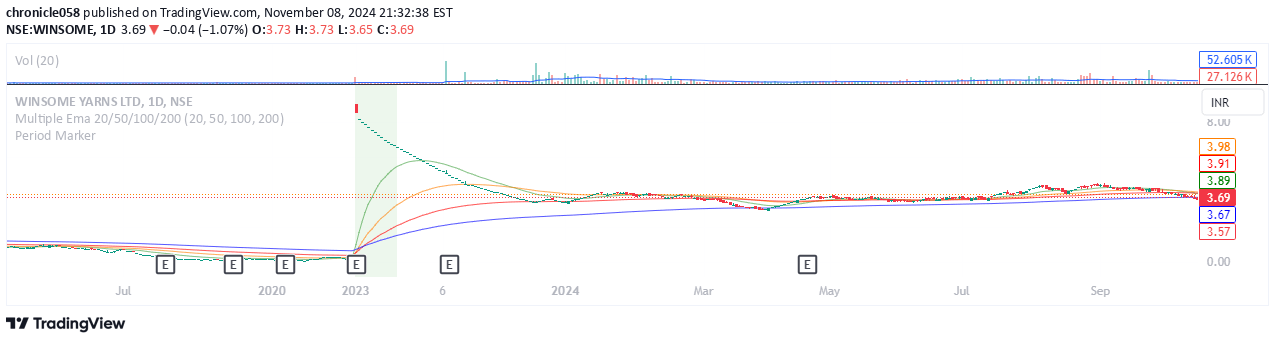
A TradingView visual tool that highlights specific date ranges on a chart, enabling easy analysis of historical periods and critical timeframes with customizable background shading.
Explore complementary indicator rolesHow it works
The Period Marker Indicator operates through a simple calendar-style date input system where users can select precise start and end dates for a specific timeframe. Once the dates are defined, the indicator automatically generates a semi-transparent shaded background over the selected period on the trading chart.
The background color can be customized to suit individual preferences, allowing traders to visually distinguish and focus on specific time intervals. As users adjust the start and end dates, the background shading dynamically updates in real-time, providing flexibility in analyzing different historical periods and market segments.
Why it may be useful
The Period Marker Indicator helps traders visually segment and analyze specific timeframes with enhanced clarity and precision. By providing a customizable shading mechanism, it allows users to quickly identify and isolate important market periods, making complex historical analysis more intuitive and accessible.
This tool is particularly valuable for traders seeking to understand market behavior during specific events, compare seasonal trends, or conduct targeted performance reviews. The ability to highlight and focus on discrete time intervals enables more nuanced and detailed market analysis, potentially revealing insights that might be overlooked in continuous chart views.
When to explore it
The Period Marker Indicator is most effective when analyzing historical market events, comparing specific timeframes, or conducting detailed performance reviews of trading strategies. Traders can use this tool to highlight earnings seasons, economic data releases, or significant geopolitical events to understand their impact on price action.
It is particularly useful for swing traders and day traders who need to isolate and examine specific market periods in depth. The indicator can help in seasonal trend analysis, backtesting trading strategies, and providing visual context for complex market movements across different time intervals.
Keep exploring
What we’ve verified
Access, alerts and repainting behaviour have not been independently verified for this indicator. Check the creator’s current publication and settings.
General descriptions and classifications are recovered research. Verified details above identify the specific checks we have completed. Check the creator’s current publication for later changes.





