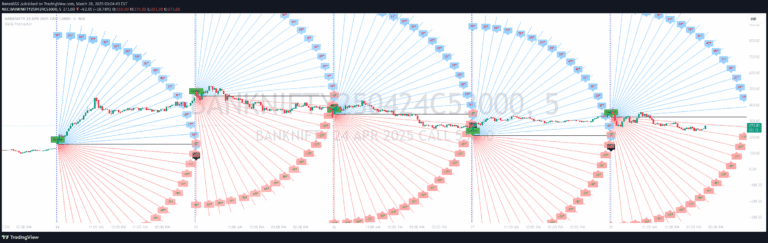
Gann Days indicator highlights specific monthly dates believed to correlate with market turning points, based on W.D. Gann's cyclical market analysis theory of predictive time windows.
Explore complementary indicator rolesHow it works
The Gann Days signal identifies specific date ranges within each month that historically show potential for significant market movements. These ranges include the 6th to 7th, 9th to 10th, 14th to 15th, 19th to 20th, 23rd to 24th, and 29th to 31st, which are marked as potentially critical periods for price action.
By highlighting these specific dates, traders can visually track potential turning points or critical market moments. The method relies on Gann's belief in cyclical market behavior, using mathematical, astrological, and numerological principles to predict when markets might experience substantial price shifts or reversals.
Why it may be useful
The Gann Days signal provides traders with a unique perspective on market timing by identifying potential critical dates for price movements. It offers an alternative approach to market analysis that goes beyond traditional technical indicators, incorporating cyclical theories and historical pattern recognition.
By drawing attention to specific date ranges, traders can anticipate possible market turning points, helping them prepare for potential volatility or significant price changes. This approach can enhance trading strategies by providing additional context and potential entry or exit signals based on Gann's time cycle theories.
When to explore it
The Gann Days signal is most effective when used in conjunction with other technical analysis tools and fundamental market research. Traders should pay special attention to these dates during periods of market uncertainty or when seeking potential trend reversal points.
This method works best for traders who are open to alternative market analysis techniques and are willing to combine Gann's time cycle theory with traditional technical indicators. It is particularly useful for traders looking to identify potential market turning points across various timeframes and financial instruments.
Keep exploring
What we’ve verified
Access, alerts and repainting behaviour have not been independently verified for this indicator. Check the creator’s current publication and settings.
General descriptions and classifications are recovered research. Verified details above identify the specific checks we have completed. Check the creator’s current publication for later changes.