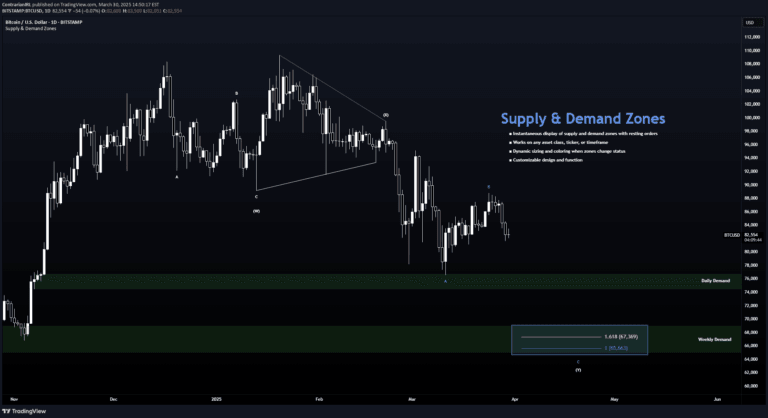
A dynamic trading indicator that tracks market swing points, identifies historical price movements, and projects potential future support and resistance levels using Gann-style analysis.
Explore complementary indicator rolesHow it works
The Historical Swing High-Low Gann Indicator operates by systematically detecting significant swing highs and lows within a specified time frame, typically defaulting to a 3-hour period. It uses advanced algorithmic detection to identify critical price turning points, marking these points on the chart and creating connecting lines that visually represent the market's price movement trajectory.
As the indicator progresses, it maintains a comprehensive historical record of all previously drawn swing lines, allowing traders to observe the cumulative market behavior over time. Additionally, the indicator extends Gann-style projection lines from the most recent swing points, which helps traders anticipate potential future support and resistance levels based on geometric price action progression.
Why it may be useful
The Historical Swing High-Low Gann Indicator provides traders with a sophisticated visual tool for understanding market dynamics and potential future price movements. By capturing and preserving historical swing points, it offers a comprehensive view of price action that goes beyond traditional static analysis, enabling traders to recognize complex market patterns and trends.
The Gann-style projections are particularly valuable, as they leverage geometric principles to forecast potential future price levels. This approach helps traders make more informed decisions by providing a structured method for identifying potential support and resistance zones, thus enhancing risk management and strategic trading approaches.
When to explore it
This indicator is most effective in markets with clear directional movement and distinct swing points, such as forex, futures, and liquid stock markets. It performs optimally in timeframes ranging from intraday to medium-term trading, where price action exhibits recognizable patterns and geometric progression.
Traders should consider using this indicator during periods of consistent market trends, when price movements show clear rhythmic characteristics. It is especially useful for day traders and swing traders who seek to understand market structure, identify potential entry and exit points, and develop a more nuanced understanding of price action dynamics.
Keep exploring
What we’ve verified
Access, alerts and repainting behaviour have not been independently verified for this indicator. Check the creator’s current publication and settings.
General descriptions and classifications are recovered research. Verified details above identify the specific checks we have completed. Check the creator’s current publication for later changes.