
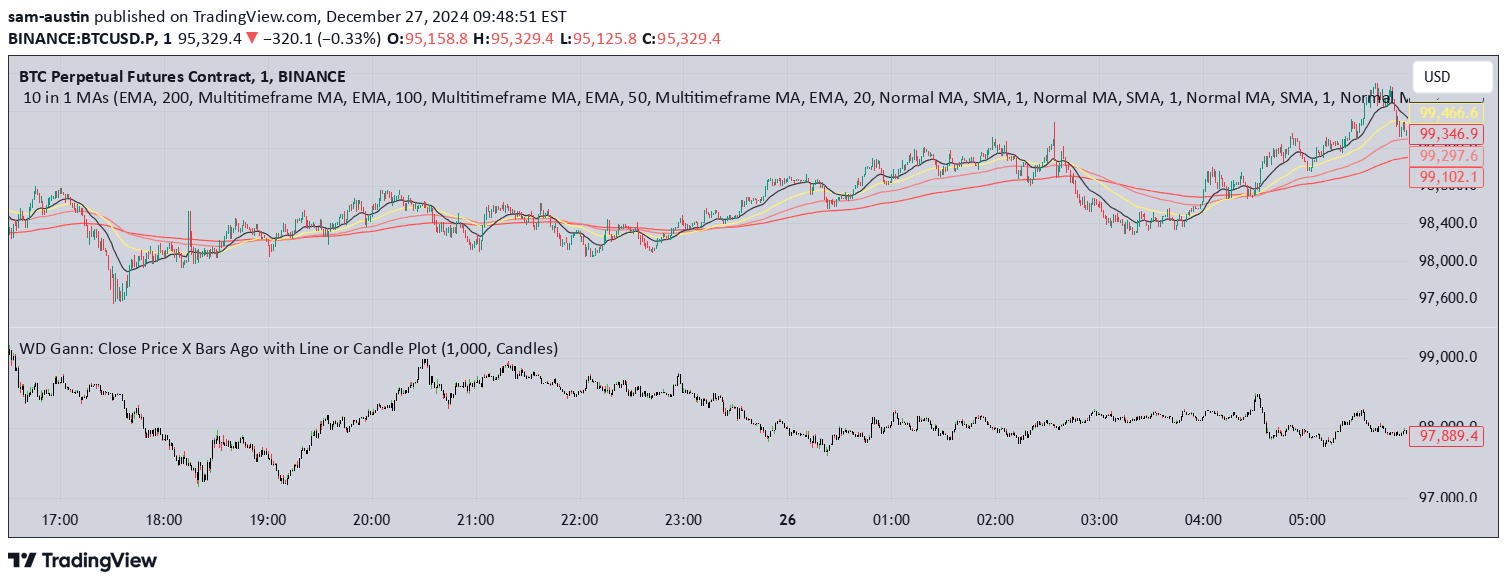
A Gann-inspired indicator tracking historical close prices from X bars ago, helping traders identify significant market cycles and potential support/resistance levels.
Explore complementary indicator rolesHow it works
The Close Price X Bars Ago indicator calculates and displays the closing price from a specified number of bars in the past. It allows traders to choose between line and candle plot types, providing flexibility in visualizing historical price data. The indicator can be customized by adjusting the number of bars to look back, enabling analysis across different timeframes.
By tracking past close prices, the indicator helps traders understand price relationships and potential market cycles. It color-codes candles to indicate bullish or bearish sentiment, with green candles representing higher closes and red candles representing lower closes, providing quick visual insights into historical market conditions.
Why it may be useful
This indicator is crucial for traders seeking to understand market dynamics through the lens of WD Gann's principles of time and price analysis. It offers a unique perspective on historical price levels, helping traders identify potential support, resistance, and reversal points based on significant numerical patterns. By examining past price behavior, traders can gain insights into market cycles and potential future movements.
The indicator's versatility allows for detailed analysis of price action, enabling traders to explore relationships between different time intervals and price levels. Its customizable features and alignment with Gann's trading theories make it a valuable tool for understanding market geometry and potential turning points.
When to explore it
The Close Price X Bars Ago indicator is most effective when analyzing markets with clear cyclical patterns and when seeking to identify potential key price levels. It works best in markets where historical price relationships and time cycles play a significant role in determining future price action. Traders can leverage this indicator across various financial instruments, including stocks, forex, and commodities.
The indicator is particularly useful during periods of market consolidation or when searching for potential trend reversals. By examining past close prices in relation to significant squared numbers, traders can uncover hidden market dynamics and potential entry or exit points. It is especially valuable for traders who incorporate Gann's geometric and cyclical analysis principles into their trading strategies.
Keep exploring
What we’ve verified
Access, alerts and repainting behaviour have not been independently verified for this indicator. Check the creator’s current publication and settings.
General descriptions and classifications are recovered research. Verified details above identify the specific checks we have completed. Check the creator’s current publication for later changes.


