Historical Swing High-Low Gann Indicator
A dynamic trading indicator that tracks market swing points, identifies historical price movements, and projects potential future support and resistance levels using Gann-style analysis.
Explore 11,183 indicators. Filter beyond the obvious.
Discover the tools that fit the way you trade.
11,183 tools to explore
A dynamic trading indicator that tracks market swing points, identifies historical price movements, and projects potential future support and resistance levels using Gann-style analysis.
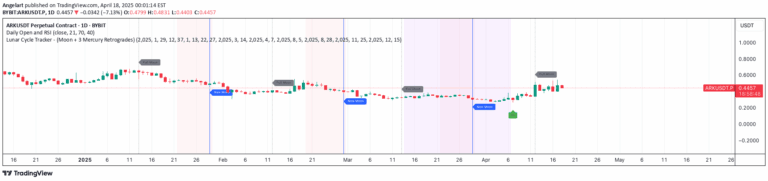
A trading indicator that overlays lunar cycles and Mercury retrograde periods onto price charts, helping traders visualize potential market timing and cyclical behavior patterns.
A Gann-inspired indicator tracking historical close prices from X bars ago, helping traders identify significant market cycles and potential support/resistance levels.
Likes, views, and comments are historical TradingView snapshots. They describe attention, not trading performance.