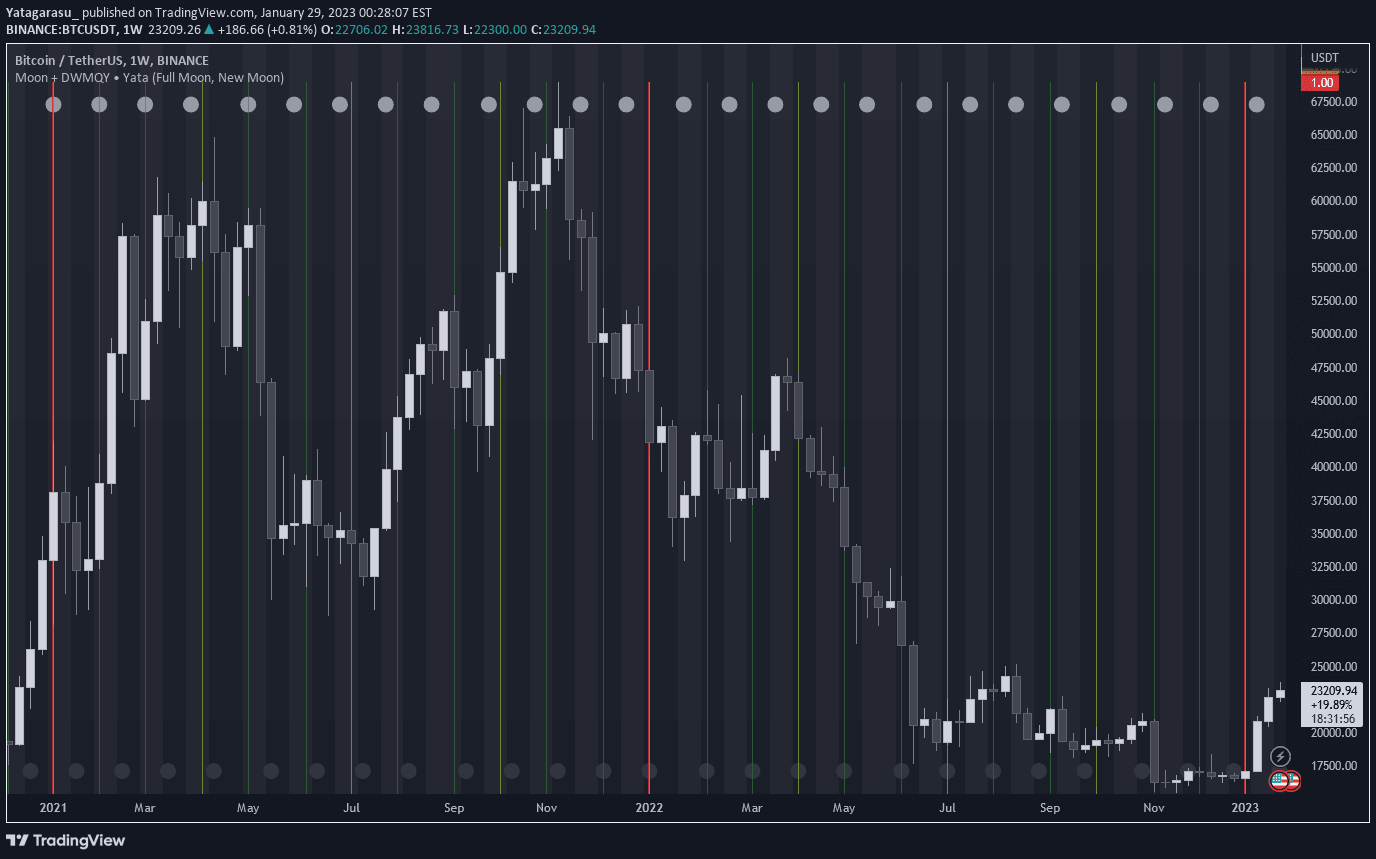
A trading indicator that uses pivot points to predict potential market breakouts and anticipated price paths across different timeframes by analyzing the last two pivot points.
Explore complementary indicator rolesHow it works
The Pivot Extremes Breakout (PEB) indicator analyzes the last two pivot points in a market to predict potential price movements and breakout zones. It calculates pivot point levels by examining recent price highs and lows, then identifies potential breakout areas based on these strategic reference points.
By creating color-coded lines and zones, the PEB visually highlights where significant market movements might occur. The indicator dynamically adjusts to different timeframes, allowing traders to quickly recognize potential breakout opportunities across various market conditions and trading instruments.
Why it may be useful
The PEB indicator simplifies complex market analysis by providing clear visual representations of potential breakout zones. It helps traders anticipate market direction by transforming abstract pivot point calculations into easily understandable graphical elements that highlight potential price movement areas.
By offering a systematic approach to identifying breakout opportunities, the PEB reduces emotional decision-making and provides traders with a structured method for evaluating market momentum. The indicator's adaptability across different timeframes makes it a versatile tool for traders seeking to improve their market entry and exit strategies.
When to explore it
The Pivot Extremes Breakout indicator works best in markets with clear trending characteristics and identifiable pivot points. It is particularly effective during periods of consolidation or when price is approaching significant support and resistance levels where potential breakouts are likely to occur.
Traders should use the PEB in conjunction with other technical analysis tools to confirm signals and validate potential trade opportunities. The indicator is most reliable in liquid markets with sufficient price movement, such as major forex pairs, stock indices, and actively traded commodities.
Keep exploring
What we’ve verified
Access, alerts and repainting behaviour have not been independently verified for this indicator. Check the creator’s current publication and settings.
General descriptions and classifications are recovered research. Verified details above identify the specific checks we have completed. Check the creator’s current publication for later changes.