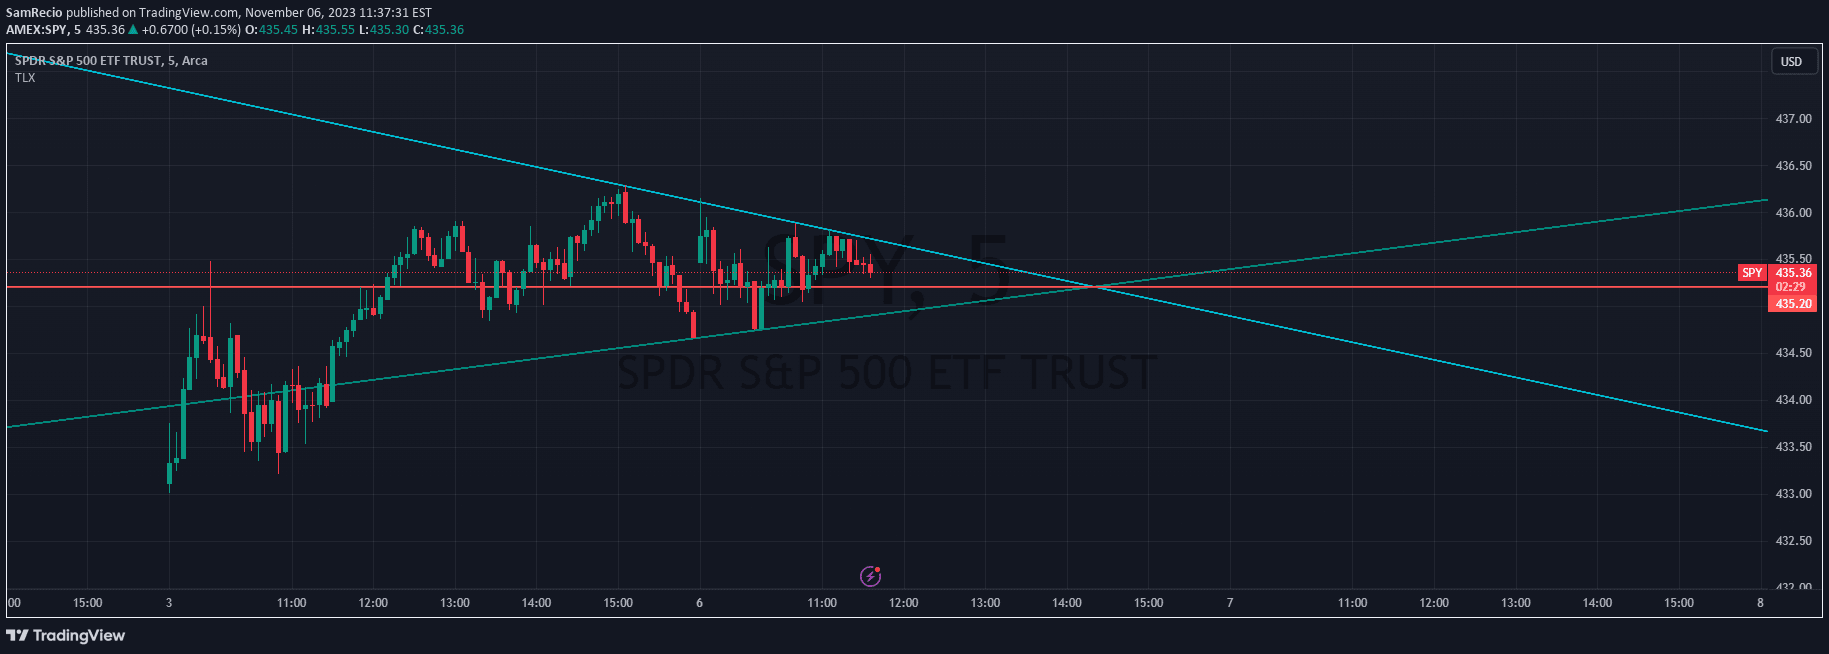
A Point and Figure charting indicator that tracks bullish and bearish trend lines, detecting proximity and providing alerts for potential market trend interactions and reversals.
Explore complementary indicator rolesHow it works
The indicator calculates slopes for bullish and bearish trend lines using specified angles and tangent calculations. It initializes and dynamically updates these trend lines based on price interactions, continuously tracking their positions and adjusting start points as market conditions change.
By establishing precise geometric relationships between price movements and trend lines, the script creates a sophisticated tracking mechanism. It monitors the current price's proximity to these trend lines, allowing for real-time detection of potential touch points and providing visual and alert-based feedback to traders.
Why it may be useful
Point and Figure trend line analysis offers traders a unique perspective on market dynamics by simplifying price movements and identifying key directional shifts. This approach helps traders cut through market noise and focus on significant trend changes, providing a more structured and disciplined method of technical analysis.
By combining geometric trend line tracking with proximity alerts, traders gain an additional layer of market insight. The indicator helps identify potential trend reversals, support and resistance levels, and critical price interaction zones, enabling more informed and strategic trading decisions.
When to explore it
This indicator is most effective in markets with clear directional trends and consistent price movements, such as forex, futures, and liquid stock markets. Traders can utilize it across multiple timeframes, from short-term scalping to longer-term swing trading, making it a versatile analytical tool.
The signal works best when combined with other technical indicators and during periods of stable market conditions. Traders should pay special attention to instances where both bullish and bearish trend lines are touched, as these moments can signal potential trend reversals or significant market inflection points.
Keep exploring
What we’ve verified
Access, alerts and repainting behaviour have not been independently verified for this indicator. Check the creator’s current publication and settings.
General descriptions and classifications are recovered research. Verified details above identify the specific checks we have completed. Check the creator’s current publication for later changes.