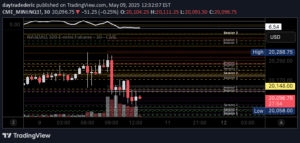
A Point and Figure vertical price target script that calculates potential price targets based on chart movements, allowing traders to hover over columns and view upside and downside targets.
Explore complementary indicator rolesHow it works
The Point and Figure vertical price target script operates by analyzing price movements within a chart using a specific box reversal method. It calculates potential price targets by tracking column changes and identifying key reversal points in the market.
The script allows customization of box size and reversal parameters, enabling traders to adapt the targeting mechanism to different market conditions and trading styles. By hovering over chart columns, traders can instantly view calculated vertical price targets for both upward and downward price movements.
Why it may be useful
This script provides traders with a dynamic and flexible tool for anticipating potential price movements and setting strategic entry and exit points. By offering immediate visual price targets, it helps traders make more informed decisions and manage risk more effectively.
The adaptability of the script's parameters allows traders to customize their analysis across different markets and timeframes, making it a versatile tool for technical analysis. Its ability to quickly calculate vertical price targets can give traders a competitive edge in understanding potential market trends.
When to explore it
The Point and Figure vertical price target script is most effective in markets with clear trending characteristics and sufficient price volatility. It works best when traders want to quickly assess potential price movement ranges and identify strategic entry and exit points.
Traders can utilize this script across various financial instruments, including stocks, futures, forex, and cryptocurrencies. It is particularly useful for traders who prefer technical analysis methods that provide clear, visual price targeting information.
Keep exploring
What we’ve verified
Access, alerts and repainting behaviour have not been independently verified for this indicator. Check the creator’s current publication and settings.
General descriptions and classifications are recovered research. Verified details above identify the specific checks we have completed. Check the creator’s current publication for later changes.