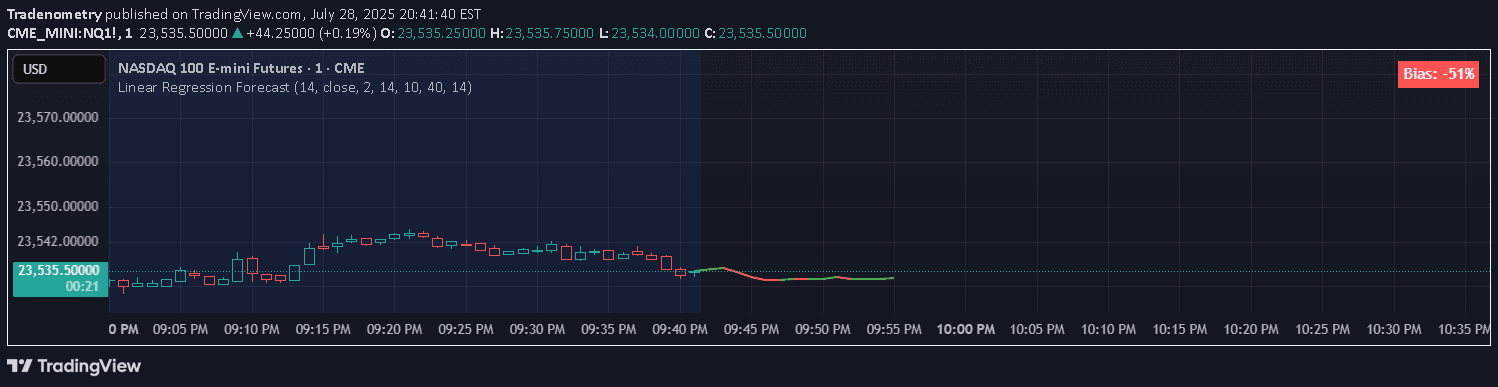
A polynomial regression slope indicator that analyzes price trends by fitting polynomial functions to data, helping traders identify market direction and potential entry/exit points.
Explore complementary indicator rolesHow it works
The Polynomial Regression Slope Indicator works by fitting a polynomial function to a specified number of historical price data points. Traders can select the polynomial degree (linear, quadratic, or cubic) to match their trading style and market characteristics.
By calculating the slope of the fitted polynomial, the indicator reveals the rate of price change over time. A positive slope indicates an upward trend, while a negative slope suggests a downward trend, providing traders with a mathematical representation of market momentum.
Why it may be useful
This indicator is crucial for traders because it provides a mathematical and objective approach to trend analysis. By using polynomial regression, traders can filter out market noise and focus on the underlying price movement, helping them make more informed trading decisions.
The slope calculation offers a clear visualization of trend direction and strength, allowing traders to identify potential trend reversals or continuations more effectively. It helps traders understand market dynamics beyond simple visual interpretation of price charts.
When to explore it
The Polynomial Regression Slope Indicator is most effective in markets with clear trending characteristics, such as forex, stocks, and commodities. It works best when used in conjunction with other technical indicators to confirm signals and reduce false positives.
Traders should be cautious of overfitting by using lower-degree polynomials and avoiding excessive complexity. It is particularly useful during periods of sustained price movement and can help traders identify potential entry and exit points in trending markets.
Keep exploring
What we’ve verified
Access, alerts and repainting behaviour have not been independently verified for this indicator. Check the creator’s current publication and settings.
General descriptions and classifications are recovered research. Verified details above identify the specific checks we have completed. Check the creator’s current publication for later changes.