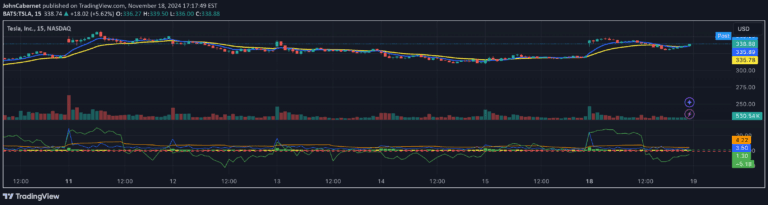
A position sizing indicator that assesses market volatility by calculating price movement ranges to help traders dynamically adjust their trading position sizes based on current market conditions.
Explore complementary indicator rolesHow it works
The Position Sizer by Volatility (PSV) calculates price movement ranges over a specified number of candles to determine current market volatility. By analyzing historical price fluctuations, it helps traders understand the potential price movement range and assess the appropriate position size relative to market conditions.
The indicator uses two primary parameters: length (number of candles) and percentile (strength of price fluctuations). These parameters allow traders to customize the volatility assessment, focusing on either longer-term trends or short-term price movements with varying degrees of sensitivity.
Why it may be useful
PSV provides traders with a dynamic risk management tool that adapts position sizes based on actual market volatility. By considering the current market conditions, traders can more precisely manage their risk exposure and prevent over-leveraging during periods of high market uncertainty.
The indicator helps traders make more informed decisions by offering a quantitative approach to position sizing. Instead of using a fixed position size, PSV allows for flexible risk management that responds to changing market dynamics, potentially improving overall trading performance and capital preservation.
When to explore it
PSV is most effective during periods of changing market volatility, such as during economic announcements, earnings reports, or significant market events. Traders can use this indicator when they want to adjust their position sizes dynamically based on recent price movement characteristics.
The indicator is particularly useful for traders who employ systematic trading strategies and require a data-driven approach to risk management. It can be applied across various financial markets, including stocks, forex, commodities, and cryptocurrencies, making it a versatile tool for different trading styles and timeframes.
Keep exploring
What we’ve verified
Access, alerts and repainting behaviour have not been independently verified for this indicator. Check the creator’s current publication and settings.
General descriptions and classifications are recovered research. Verified details above identify the specific checks we have completed. Check the creator’s current publication for later changes.