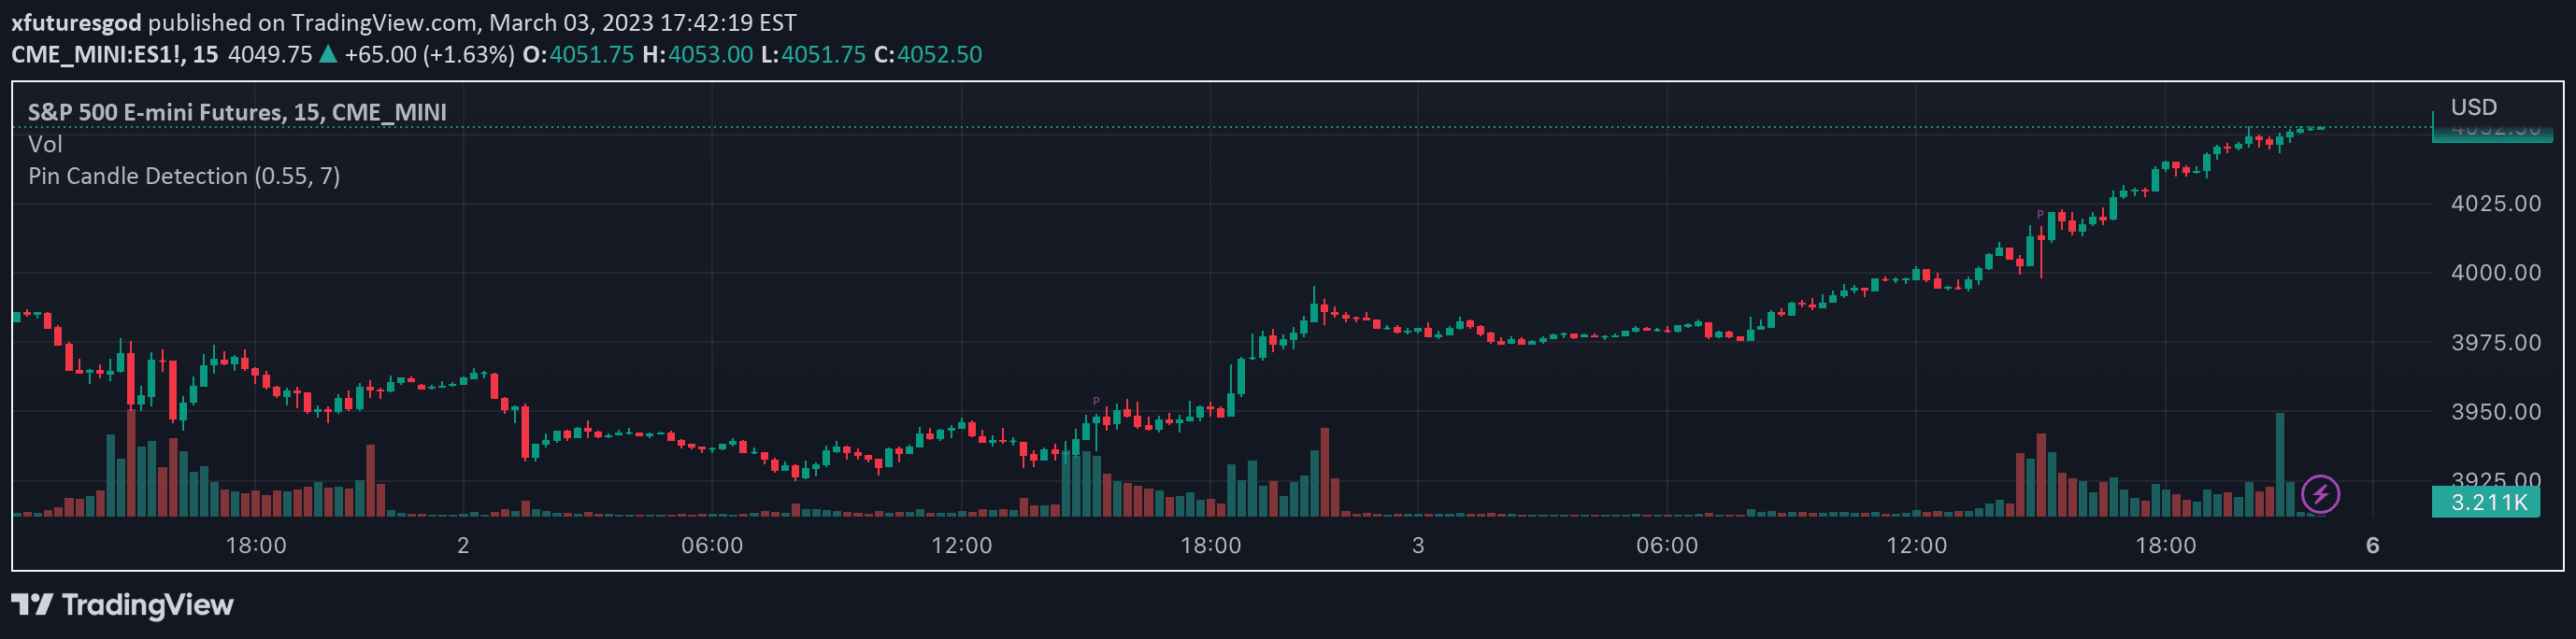
A trading signal based on candlestick patterns that identifies potential trend reversals by comparing current and previous candle body sizes and closing prices.
Explore complementary indicator rolesHow it works
The PreannFX indicator analyzes candlestick patterns by comparing the current candle's body size and closing price with the previous candle. For a bullish signal, the current candle must close higher than the previous candle's high and have a larger body size. Conversely, a bearish signal occurs when the current candle closes lower than the previous candle's low and has a larger body size.
Traders use this signal to identify potential trend reversals and momentum shifts. Entry points are strategically determined based on the previous candle's open or high/low levels, with stop loss and take profit levels calculated using a 1:1 risk management approach.
Why it may be useful
The PreannFX indicator provides traders with a visual and quantitative method to identify potential trend changes and momentum shifts in the market. By comparing consecutive candle characteristics, traders can quickly recognize potential entry and exit points with clear, predefined rules.
This signal is particularly valuable because it offers a structured approach to interpreting price action, reducing emotional decision-making and providing a systematic method for assessing market sentiment. The visual representation with green and red arrows makes it easy for traders to quickly understand potential trading opportunities.
When to explore it
The PreannFX indicator works best in markets with clear, distinct candlestick patterns and moderate volatility. It is most effective on shorter timeframes such as 1-minute, 5-minute, and 15-minute charts, making it ideal for scalping and day trading strategies.
Traders should use this signal in conjunction with other technical indicators to confirm potential trade setups. The signal is particularly useful in trending markets where momentum shifts are more likely to occur. Traders should be cautious during periods of low liquidity or significant news events, as these conditions can produce less reliable candlestick patterns.
Keep exploring
What we’ve verified
Access, alerts and repainting behaviour have not been independently verified for this indicator. Check the creator’s current publication and settings.
General descriptions and classifications are recovered research. Verified details above identify the specific checks we have completed. Check the creator’s current publication for later changes.