
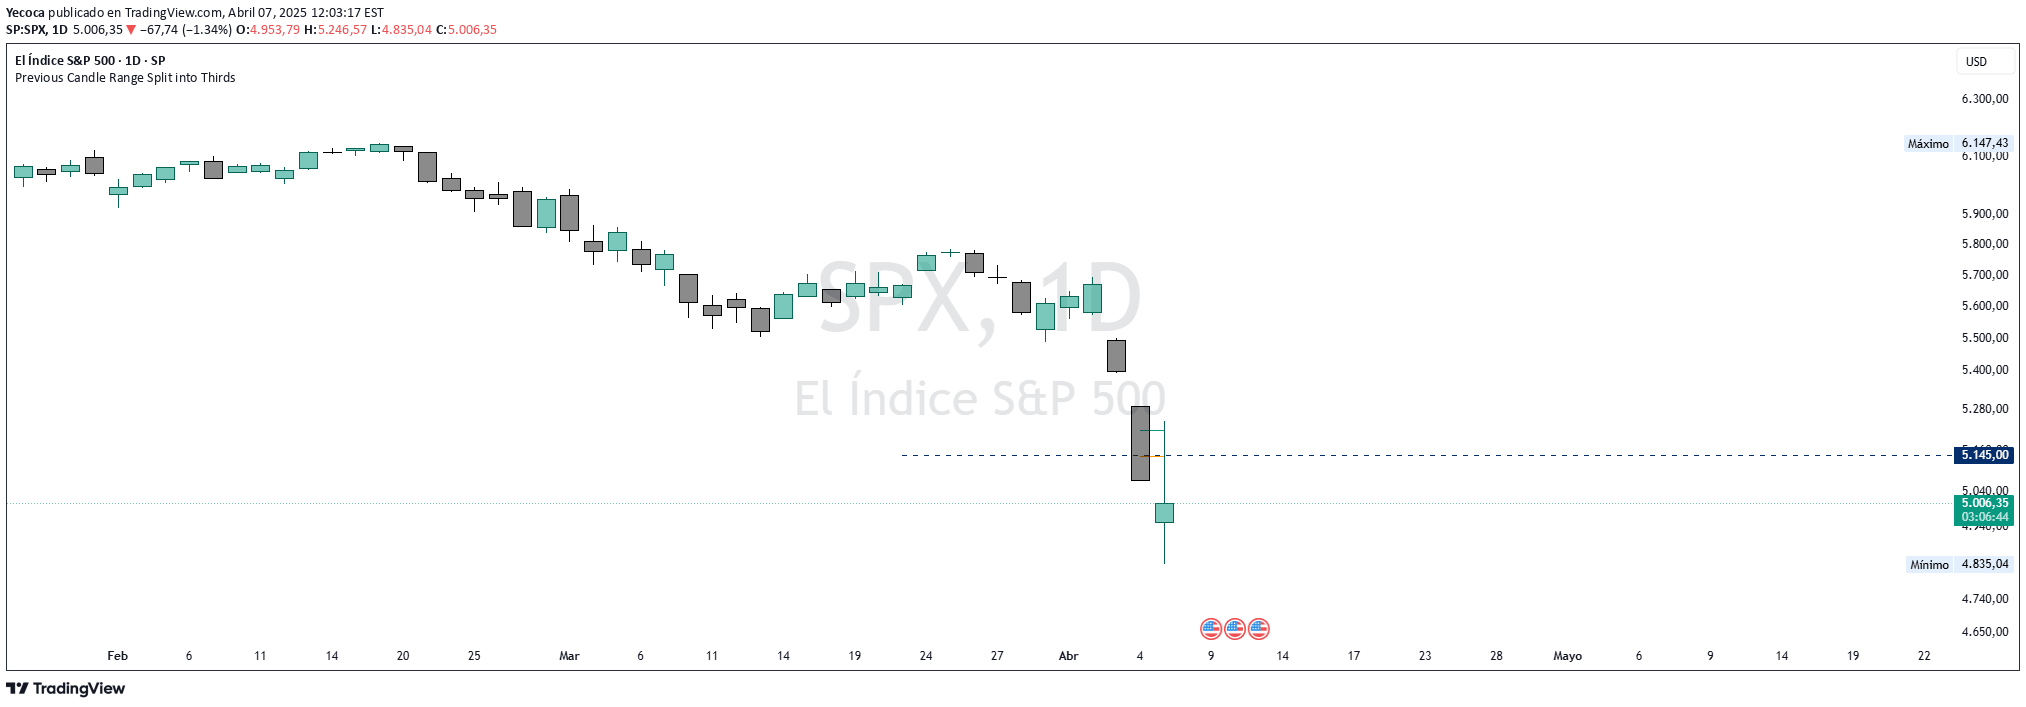
A visual tool that divides the previous candle's range into three equal parts, helping traders understand price action and potential market sentiment within a single candlestick.
Explore complementary indicator rolesHow it works
The indicator creates two horizontal lines that split the previous candle's total range from low to high into three equal sections. The first line is positioned at 33% from the low, and the second line at 66% from the low.
These lines help visualize where the candle closed within its range. Traders can customize the lines' color, width, and style. The lines provide a quick visual representation of the candle's price action. The tool plots these lines automatically on the previous candle for easy interpretation
Why it may be useful
Understanding the location of a candle's close within its range can provide insights into market sentiment and potential momentum. The three-part division helps traders quickly assess whether buyers or sellers were dominant during the trading session.
It offers a simple visual method to gauge price action strength. This tool can help identify potential trend continuation or reversal signals. The customizable nature allows traders to adapt the indicator to their specific trading style. It provides a quick, at-a-glance view of price behavior
When to explore it
This indicator works best during trending markets with clear price movement. It is most effective on daily, 4-hour, and 1-hour charts where individual candle characteristics are more meaningful. Traders can use it to complement other technical analysis tools and confirm potential entry or exit points.
It is particularly useful for swing and day traders who want to understand short-term price dynamics. The tool can help identify potential momentum shifts and market sentiment changes. It is most valuable when combined with other technical indicators
Keep exploring
What we’ve verified
Access, alerts and repainting behaviour have not been independently verified for this indicator. Check the creator’s current publication and settings.
General descriptions and classifications are recovered research. Verified details above identify the specific checks we have completed. Check the creator’s current publication for later changes.


