
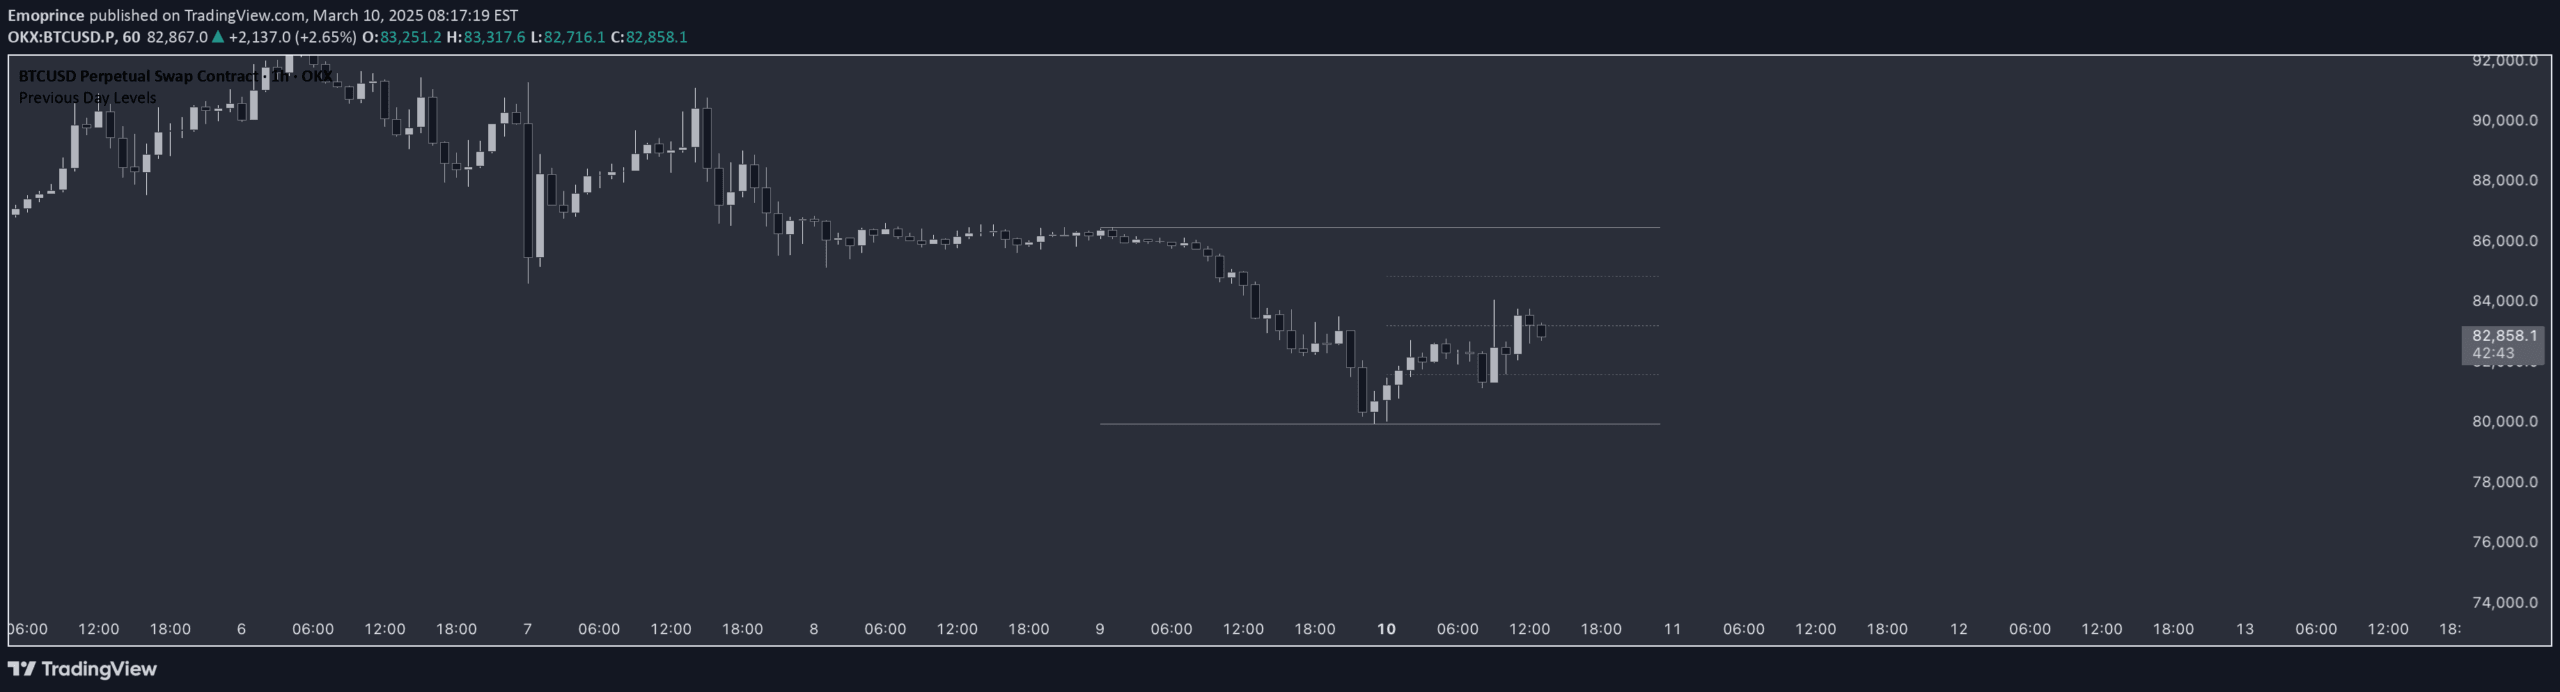
Previous Day Levels indicator plots prior trading session's high, low, and mid-point to help traders analyze price action and identify potential market bias and directional tendencies.
Explore complementary indicator rolesHow it works
The Previous Day Levels indicator automatically calculates and plots key price levels from the previous trading session, including the high (100%), low (0%), and intermediate levels at 25%, 50%, and 75%. These levels are displayed as horizontal lines on the current day's chart, creating a visual framework for price action analysis.
Traders can observe how the current price interacts with these predefined levels, using them as potential support and resistance zones. The 50% level serves as a critical reference point for determining market bias, with price performance above or below this midpoint suggesting bullish or bearish tendencies for the current trading session.
Why it may be useful
The Previous Day Levels indicator provides traders with a structured approach to understanding market dynamics by revealing key price levels from the previous trading session. By offering a clear visual representation of historical price ranges, traders can quickly identify potential support and resistance zones and assess the market's current directional momentum.
This tool helps traders make more informed decisions by providing context for current price action and highlighting potential areas of market interest. The indicator's simplicity and ability to quickly communicate market sentiment make it a valuable tool for traders seeking to develop a more strategic approach to market analysis.
When to explore it
The Previous Day Levels indicator is most effective for intraday and short-term traders who focus on capturing quick price movements and understanding market sentiment. It works particularly well in markets with consistent daily trading patterns, such as forex, futures, and actively traded stocks.
Traders should use this indicator when they want to quickly assess the market's potential directional bias and identify key price levels that might influence trading decisions. It is especially useful during volatile market conditions or when looking to establish short-term trading strategies based on recent price action.
Keep exploring
What we’ve verified
Access, alerts and repainting behaviour have not been independently verified for this indicator. Check the creator’s current publication and settings.
General descriptions and classifications are recovered research. Verified details above identify the specific checks we have completed. Check the creator’s current publication for later changes.


