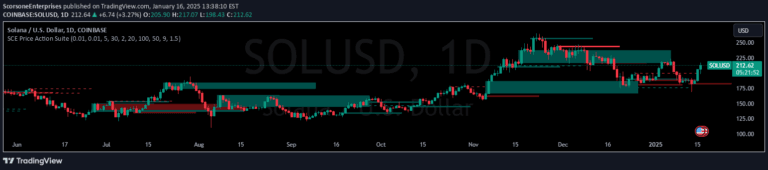
A technical analysis strategy combining Accumulation/Distribution and On-Balance Volume divergence with candlestick reversal patterns to identify potential market turning points and smart money movements.
Explore complementary indicator rolesHow it works
This trading signal integrates two volume indicators (A/D and OBV) to detect potential market reversals by analyzing divergence patterns. It identifies positive and negative divergences that signal smart money movements. Additionally, it incorporates specific Japanese candlestick patterns like Morning Star, Bullish Engulfing, and Hammer to confirm potential trend changes.
When these volume indicators show divergence and a corresponding candlestick pattern appears, traders can identify stronger buy or sell signals. The system looks for discrepancies between price action and volume trends to predict potential market reversals
Why it may be useful
This trading signal provides traders with a more comprehensive approach to market analysis by combining volume indicators and candlestick patterns. It helps investors identify potential trend reversals more accurately by examining both price and volume dynamics.
The method allows traders to detect smart money movements and understand underlying market sentiment. By integrating multiple technical analysis tools, the signal reduces the likelihood of false signals and improves decision-making. Traders can use this approach to potentially enter or exit trades with greater confidence and precision
When to explore it
This trading signal works best in markets with clear trends and significant volume fluctuations. It is most effective during swing trading scenarios where price movements are more pronounced and volume patterns are distinct.
Traders should apply this signal in liquid markets with sufficient trading volume, such as major stock indices, forex pairs, and heavily traded commodities. The strategy is particularly useful during periods of market transition, when trends might be changing. Avoid using this signal during extremely low-volume periods or in highly erratic market conditions
Keep exploring
What we’ve verified
Access, alerts and repainting behaviour have not been independently verified for this indicator. Check the creator’s current publication and settings.
General descriptions and classifications are recovered research. Verified details above identify the specific checks we have completed. Check the creator’s current publication for later changes.