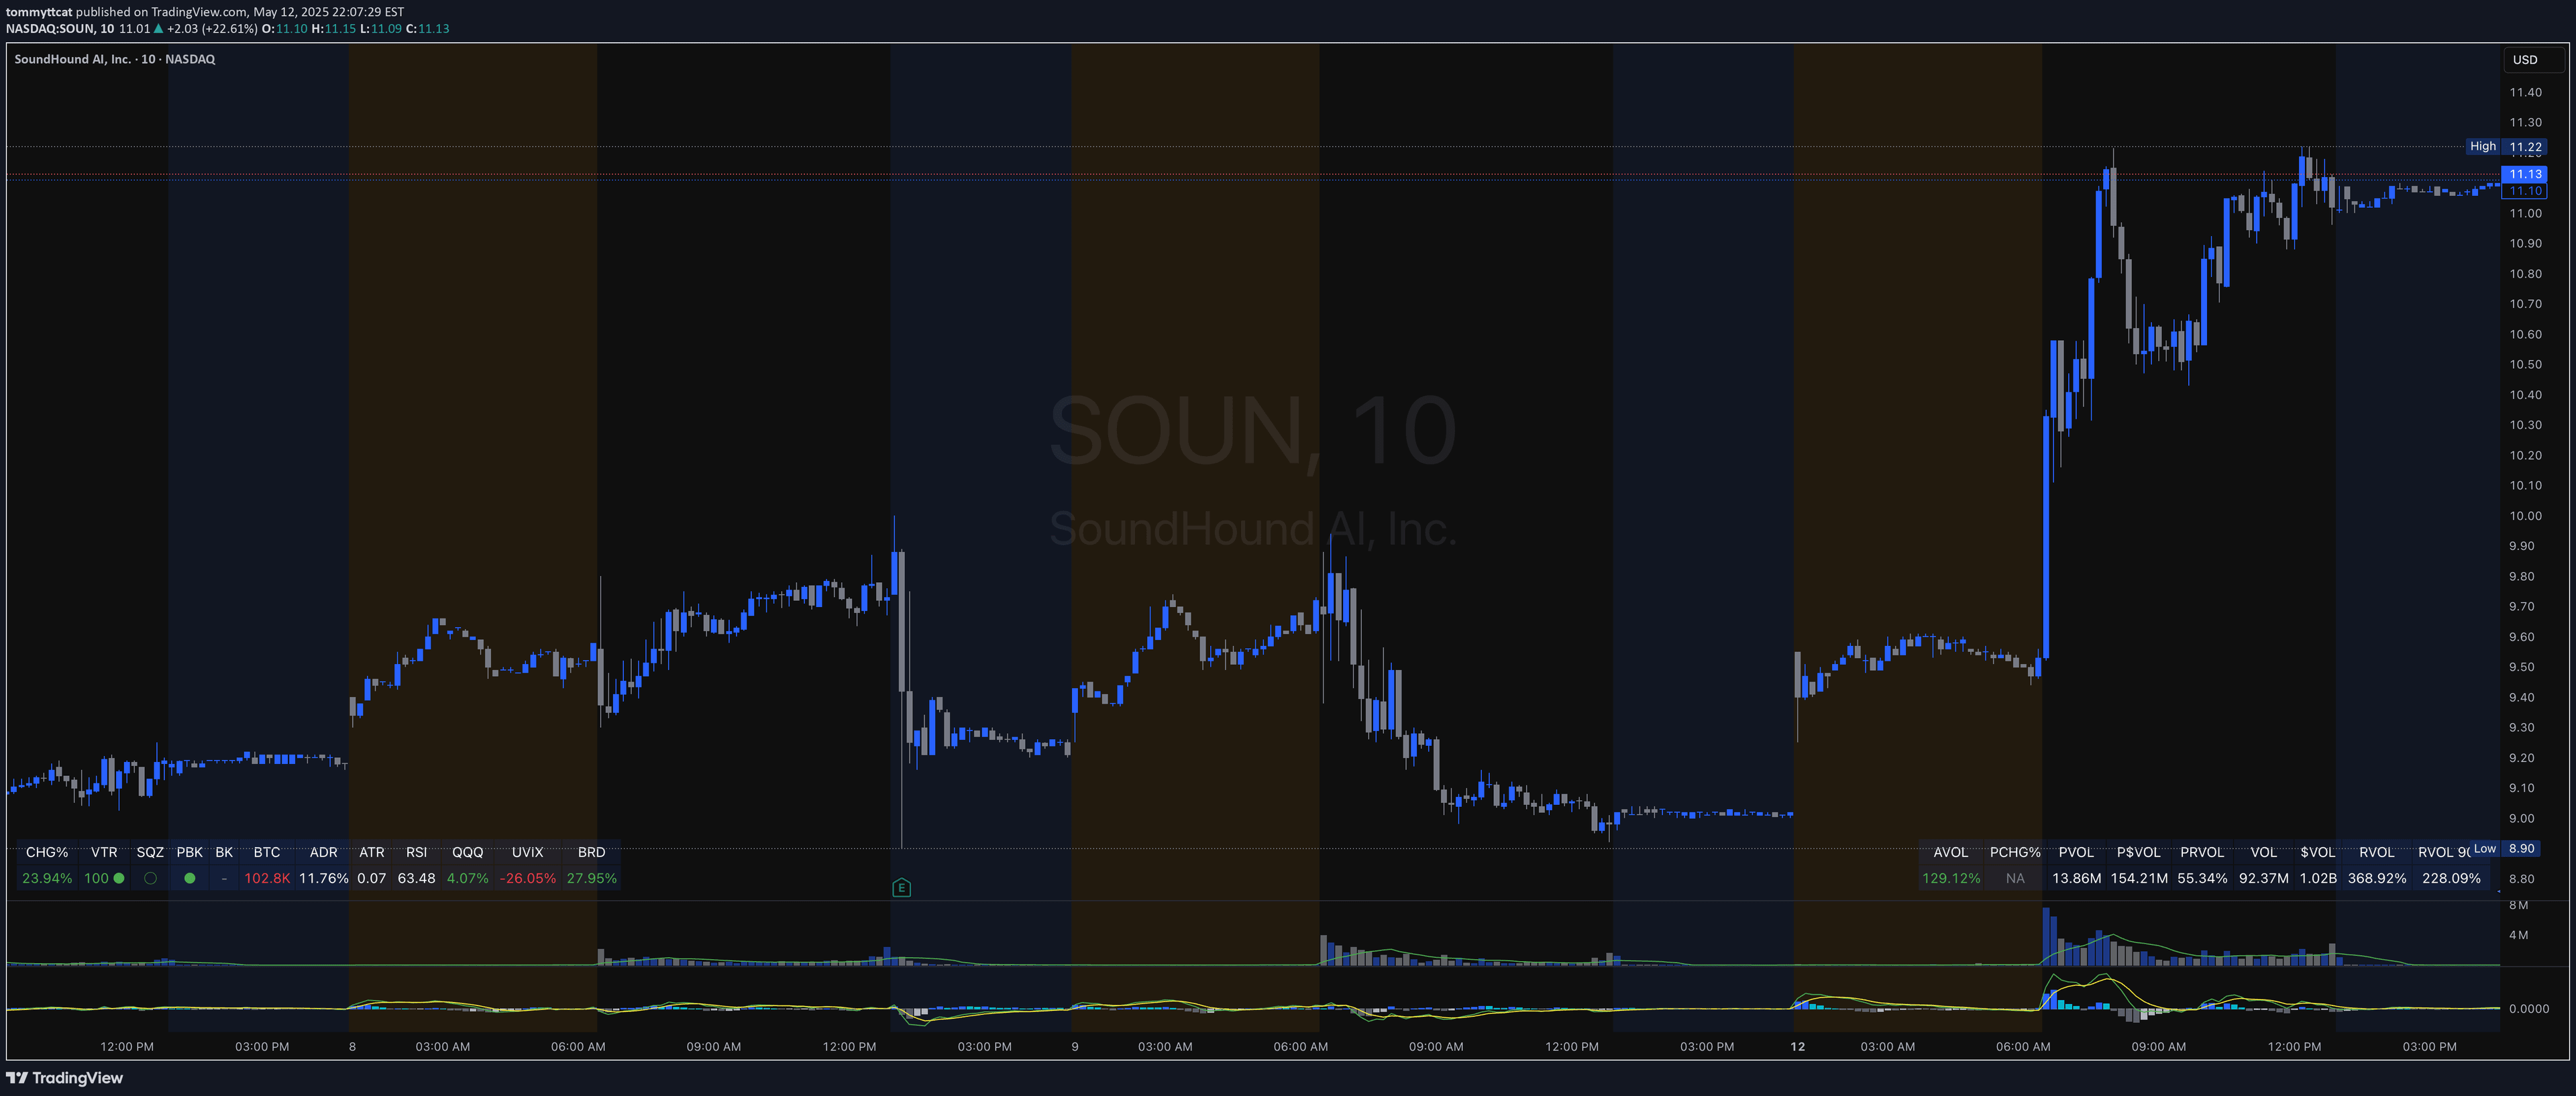
An advanced market indicator analyzing 7-day price and open interest changes to reveal market dynamics across futures and spot markets through color-coded visualizations.
Explore complementary indicator rolesHow it works
The Price and OI Change indicator calculates the 7-day percentage changes in both price and open interest to provide insights into market momentum and trader behavior. It uses a color-coded system to represent different market conditions, with each color signaling a specific market state such as leverage-driven trends, spot market activity, or potential sell-offs.
By tracking the top 3 BTC futures contracts' average open interest from major exchanges, the indicator offers a comprehensive view of market sentiment and liquidity. The background colors shift dynamically to represent four distinct market scenarios: leverage-driven bullish trends, spot market bullish trends, potential liquidation phases, and bearish market conditions with reduced leverage.
Why it may be useful
This indicator provides traders with a nuanced understanding of market dynamics beyond simple price movement by integrating open interest data and visual color signals. It helps traders identify underlying market trends, distinguish between different types of market momentum, and understand whether price movements are driven by spot trading or leveraged positions.
By offering a multi-dimensional view of market conditions, the indicator enables traders to make more informed decisions about market entry and exit points. The color-coded system allows for quick visual interpretation of complex market data, making it easier to assess market strength, potential liquidation risks, and overall trading sentiment.
When to explore it
The Price and OI Change indicator is most effective in volatile markets with significant futures and spot trading activity, particularly in cryptocurrency markets where leverage plays a crucial role. Traders can use this tool during periods of uncertain market direction to gain insights into the underlying market mechanics and potential trend reversals.
It is particularly valuable for futures traders seeking to understand market liquidity and potential shifts in trader sentiment. The indicator works best when combined with other technical analysis tools, providing a comprehensive view of market conditions and helping traders identify potential trading opportunities across different timeframes.
Keep exploring
What we’ve verified
Access, alerts and repainting behaviour have not been independently verified for this indicator. Check the creator’s current publication and settings.
General descriptions and classifications are recovered research. Verified details above identify the specific checks we have completed. Check the creator’s current publication for later changes.