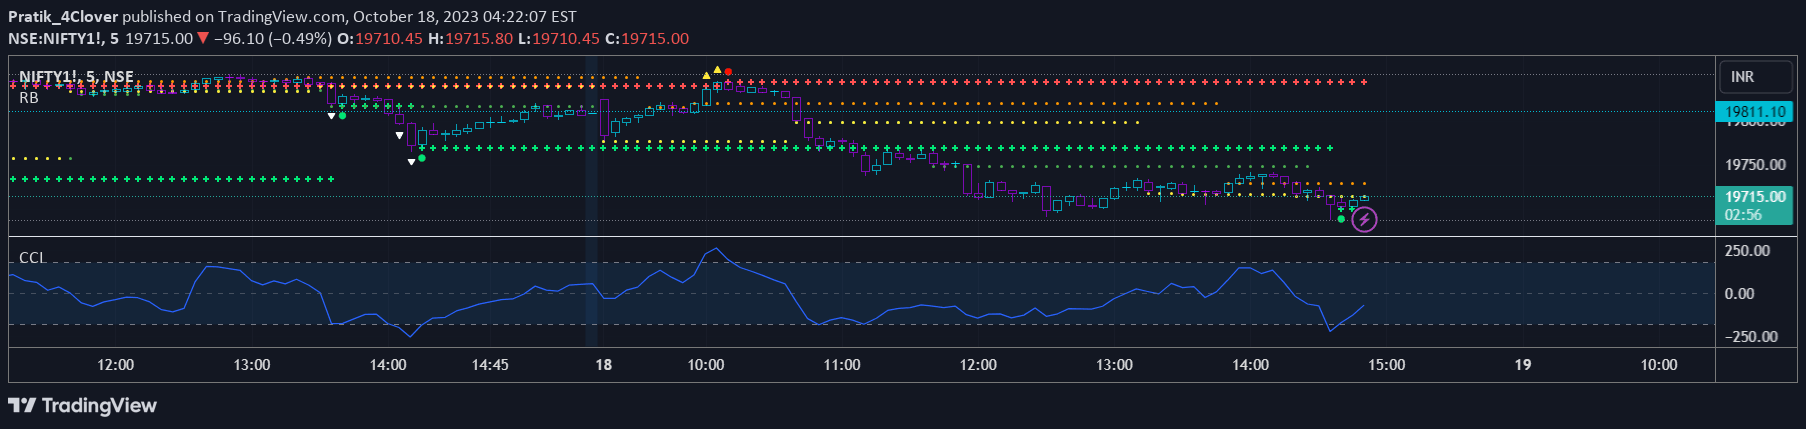
A signal that measures percentage retracement from the previous candle's high to low, providing insight into potential price pullback levels and market momentum.
Explore complementary indicator rolesHow it works
The percentage retrace indicator calculates the price movement between a candle's high and low points, expressing this as a percentage decline. By default, it typically sets a 10% threshold, but this can be dynamically adjusted based on trader preference and market conditions.
Traders can customize the percentage level to suit different asset classes and trading styles, allowing for flexible analysis of price pullbacks. The indicator helps visualize the magnitude of price retracements, providing a quick visual representation of potential support or resistance levels within short-term price action.
Why it may be useful
Understanding percentage retracements helps traders identify potential entry and exit points by measuring the depth of price pullbacks during trending markets. It provides a quantitative method to assess the strength of price movements and potential reversal zones, which can be crucial for risk management.
By offering a standardized view of price corrections, this indicator allows traders to make more informed decisions about market momentum and potential trend continuation or reversal. It serves as a valuable tool for quickly assessing market dynamics and potential trading opportunities across different timeframes.
When to explore it
The percentage retrace indicator works best in trending markets with clear directional movements, where price pullbacks are likely to follow predictable patterns. It is particularly useful during periods of consistent price action, such as during strong bullish or bearish trends.
Traders should apply this indicator in conjunction with other technical analysis tools to confirm signals and reduce false positives. It is most effective when used on timeframes ranging from short-term (minutes) to medium-term (hours), making it especially suitable for scalping and day trading strategies.
Keep exploring
What we’ve verified
Access, alerts and repainting behaviour have not been independently verified for this indicator. Check the creator’s current publication and settings.
General descriptions and classifications are recovered research. Verified details above identify the specific checks we have completed. Check the creator’s current publication for later changes.