
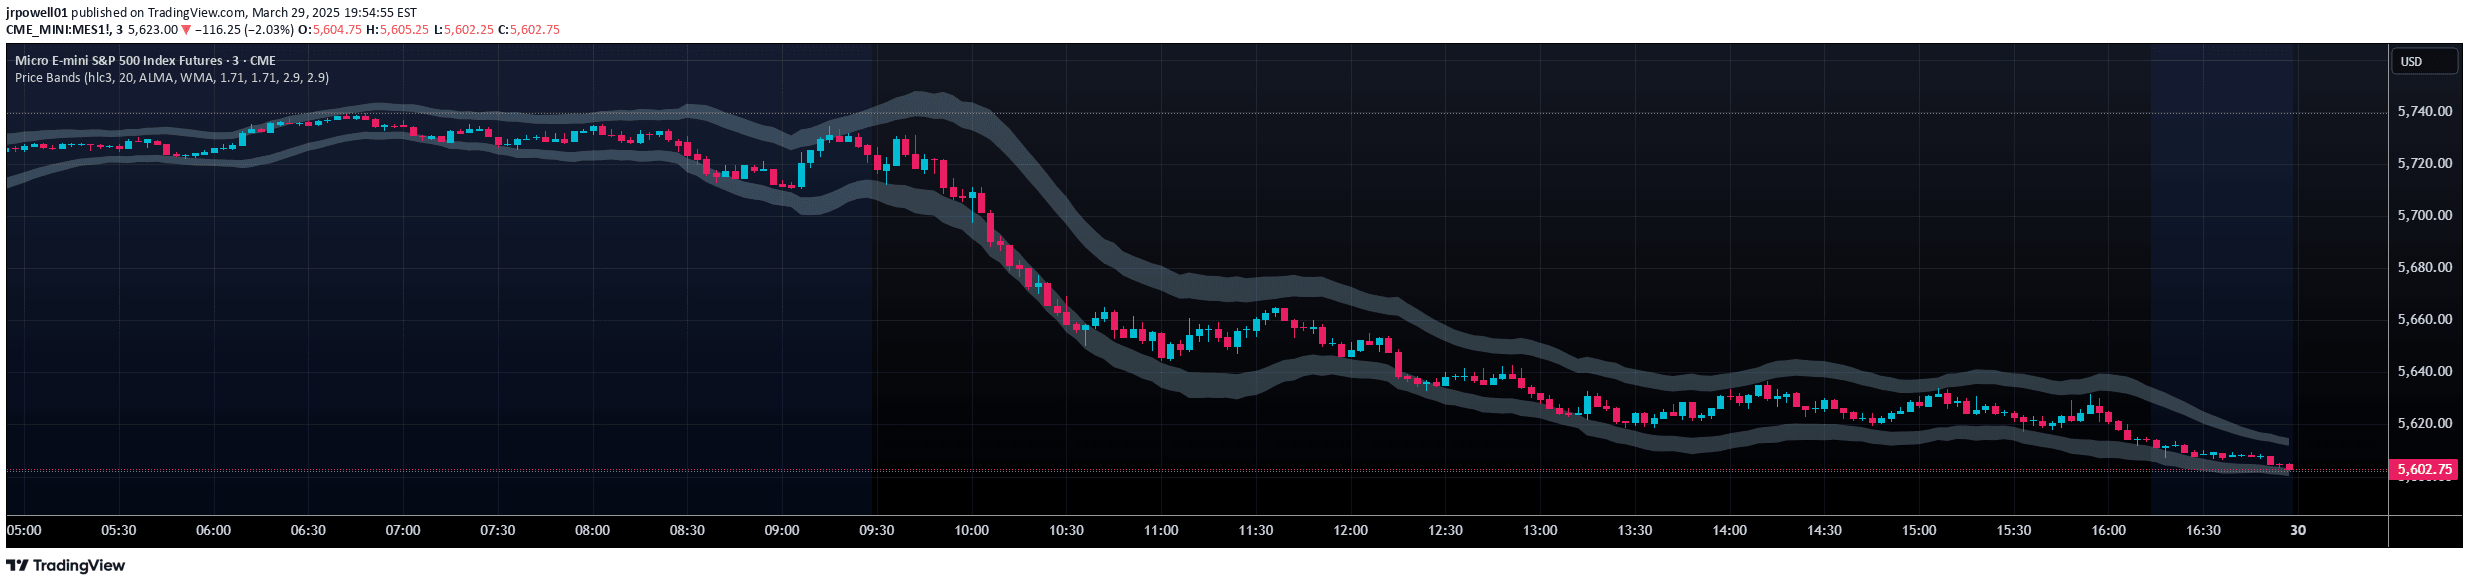
Price Extreme Bands is a custom indicator that identifies price volatility and momentum using Exponential Moving Average and True Range with unique smoothing techniques.
Explore complementary indicator rolesHow it works
The indicator calculates an Exponential Moving Average (EMA) as a basis line and then derives upper and lower bands using True Range Average True Range (TR ATR). It applies two fixed multipliers (1.71 and 2. 50) to create these bands.
A custom Super Smoother function is then used to reduce noise and smooth the band calculations. The indicator plots these bands and creates filled zones between the inner and outer bands to highlight potential volatility ranges
Why it may be useful
Price Extreme Bands provide traders with a nuanced view of market volatility and potential price extremes. By visualizing bands that adapt to market conditions, traders can quickly identify areas of increased price momentum and potential reversal points.
The smoothing technique helps reduce market noise, making it easier to interpret price movements. The filled zones offer clear visual cues about potential trading ranges and momentum shifts
When to explore it
This indicator is most effective on intraday timeframes, particularly from 1-minute to 15-minute charts. Traders should use it when seeking to understand short-term price volatility and momentum. It works best in markets with clear trending or ranging behaviors.
The bands are particularly useful when price approaches outer zones, signaling potential overbought or oversold conditions. Traders can use these signals for entry, exit, or trend confirmation strategies
Keep exploring
What we’ve verified
Access, alerts and repainting behaviour have not been independently verified for this indicator. Check the creator’s current publication and settings.
General descriptions and classifications are recovered research. Verified details above identify the specific checks we have completed. Check the creator’s current publication for later changes.


