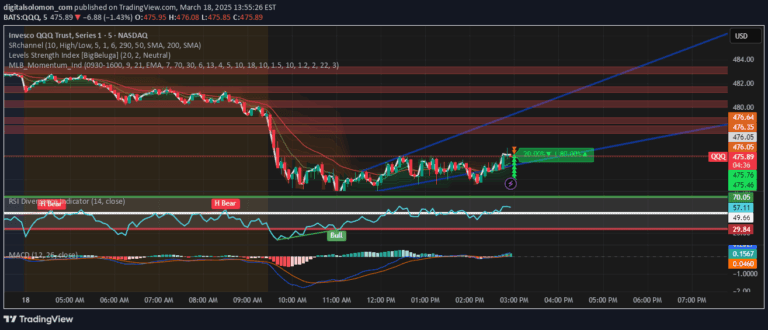
A specialized indicator that detects significant price gaps between consecutive candles, helping traders identify potential market breakouts and sudden price movements.
Explore complementary indicator rolesHow it works
The Jump Candle Indicator analyzes price movements between consecutive candles by detecting substantial gaps in opening and closing prices. It uses a user-defined threshold to identify significant price jumps, typically set at $0.50 or a custom value. The indicator generates signals by examining two primary conditions: gap up and gap down scenarios.
For a bullish signal, the current candle's open must be higher than the previous close, and the candle must close higher than its opening price. Conversely, a bearish signal occurs when the current candle opens lower than the previous close and closes below its opening price.
Why it may be useful
The Jump Candle Indicator provides traders with a unique method of identifying potential market inefficiencies and sudden price movements that might indicate important trading opportunities. By focusing specifically on price gaps, traders can quickly spot moments of high market volatility and potential trend reversals.
This indicator is particularly valuable because it cuts through noise and highlights significant price actions that might be missed by traditional momentum indicators. It offers clear visual signals through green and red triangles, making it easy for traders to quickly recognize and interpret potential trading opportunities across different market conditions.
When to explore it
The Jump Candle Indicator is most effective during periods of high market volatility, such as after major news events, earnings reports, or economic announcements. Traders can use this tool to identify potential breakout zones and assess market sentiment during rapid price movements.
It is particularly useful for breakout traders, mean reversion strategies, and traders focusing on news-driven market events. However, traders should always combine this indicator with additional confirmation signals like volume analysis, support and resistance levels, and broader trend analysis to improve trading decision-making.
Keep exploring
What we’ve verified
Access, alerts and repainting behaviour have not been independently verified for this indicator. Check the creator’s current publication and settings.
General descriptions and classifications are recovered research. Verified details above identify the specific checks we have completed. Check the creator’s current publication for later changes.