
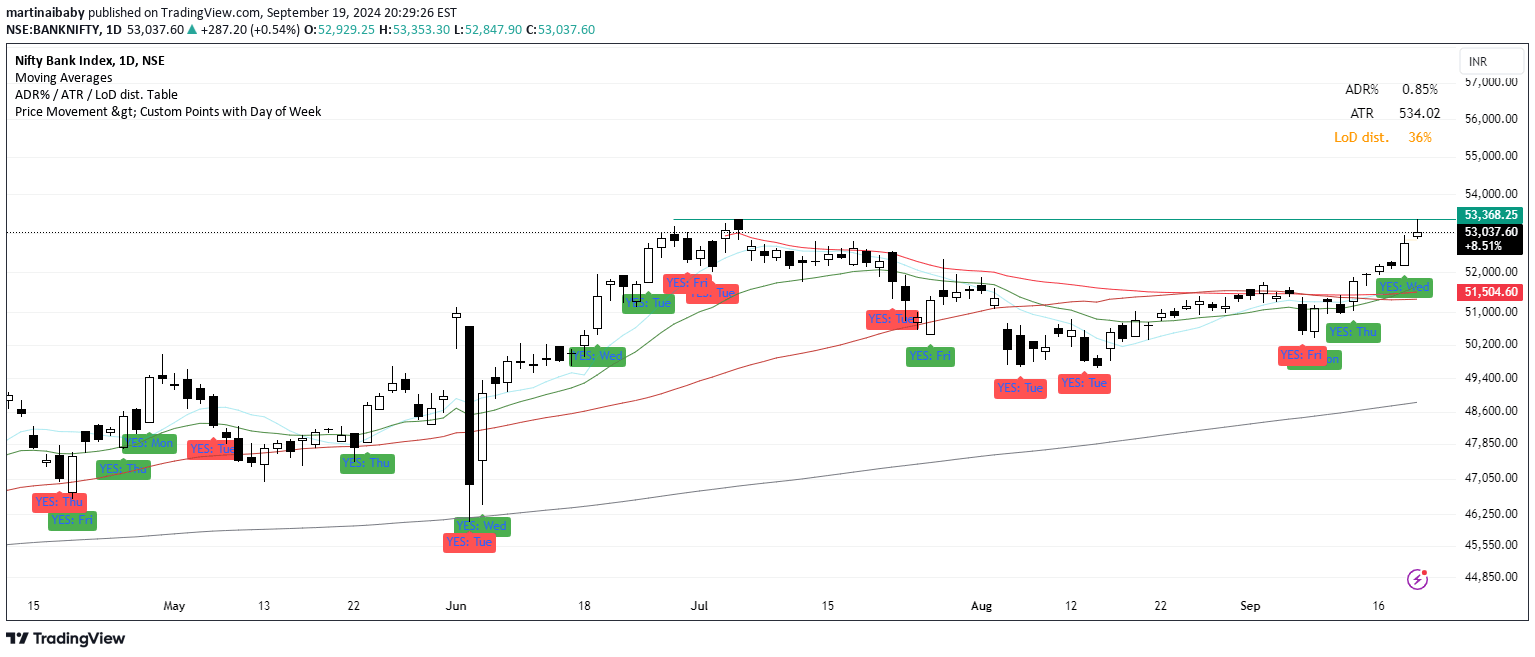
A trading indicator that tracks significant price movements by comparing opening and closing prices against a user-defined threshold, highlighting days with substantial market volatility.
Explore complementary indicator rolesHow it works
The indicator calculates price movement by comparing the opening and closing prices of each market bar or candle. It applies a user-defined threshold to determine significant price changes, marking movements that exceed this point value as positive or negative.
When the price movement surpasses the specified threshold, the script generates visual markers on the chart. For positive movements, it displays a green 'YES' label, while negative movements are indicated by a red 'YES' label, providing traders with an immediate visual representation of substantial price shifts.
Why it may be useful
This indicator helps traders quickly identify days with significant market volatility, which can be crucial for making informed trading decisions. By highlighting substantial price movements, it provides insights into potential trend changes and market momentum that might otherwise be overlooked.
The visual representation allows traders to rapidly scan historical price data and recognize patterns of market behavior. This can be particularly valuable for developing trading strategies, understanding market dynamics, and making more precise entry and exit decisions based on meaningful price fluctuations.
When to explore it
The indicator is most effective in markets with potential for high volatility, such as cryptocurrencies, emerging market stocks, or during periods of economic uncertainty. Traders can adjust the threshold to match the specific characteristics of the asset they are trading, making it adaptable to different market conditions.
It is particularly useful for day traders and scalpers who need to quickly assess intraday price movements and identify potential trading opportunities. The tool can help filter out minor price fluctuations and focus attention on significant market events that may signal important trend changes or momentum shifts.
Keep exploring
What we’ve verified
Access, alerts and repainting behaviour have not been independently verified for this indicator. Check the creator’s current publication and settings.
General descriptions and classifications are recovered research. Verified details above identify the specific checks we have completed. Check the creator’s current publication for later changes.


