
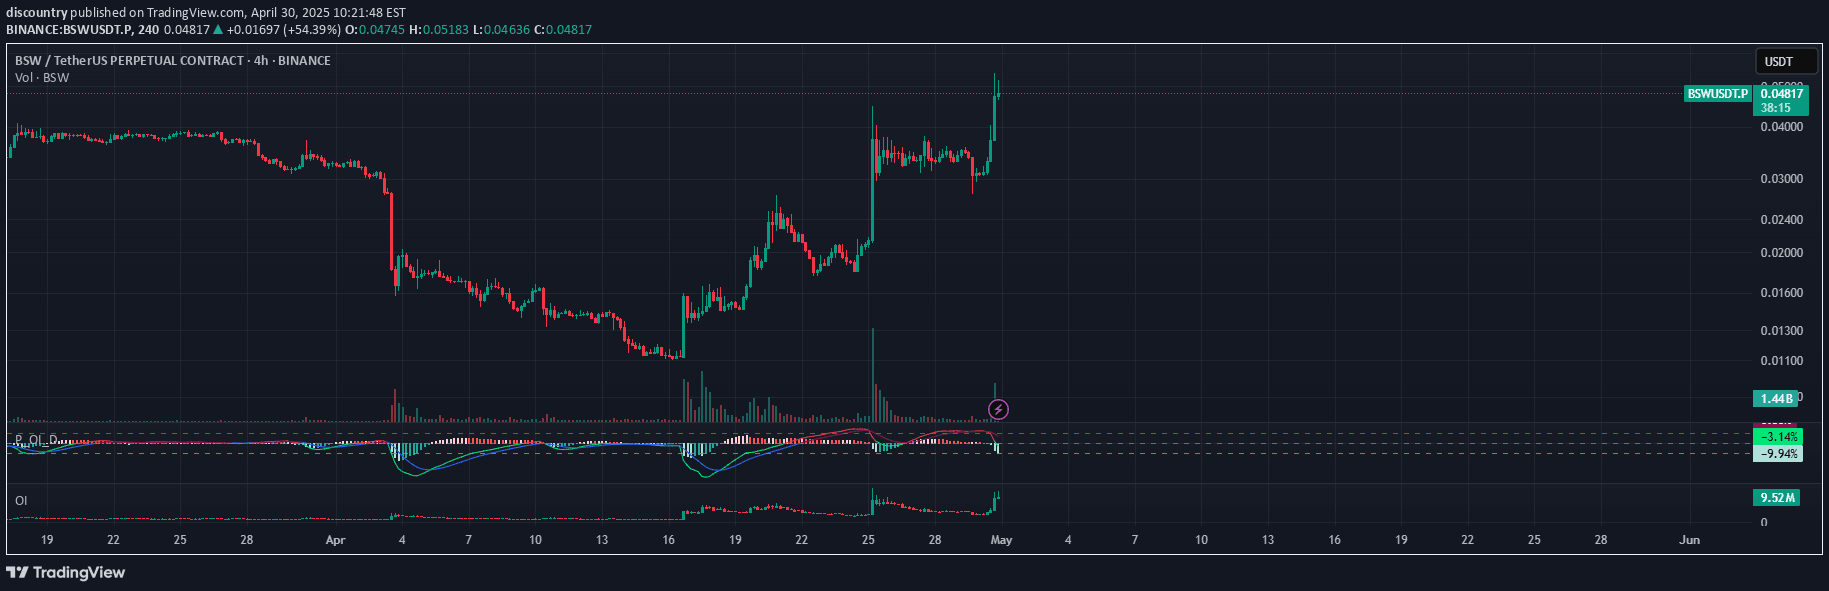
Price OI Division Indicator analyzes price momentum and open interest relationship using a modified MACD approach. It provides visual insights into market positioning and potential trend changes.
Explore complementary indicator rolesHow it works
The Price OI Division Indicator operates by calculating normalized price and open interest momentum using a MACD-like approach. It compares short-term and long-term price movements while incorporating open interest data to reflect market positioning.
The indicator generates a divergence histogram that highlights the difference between price and open interest momentum. It plots this histogram alongside MACD and signal lines, with color-coded signals to help traders quickly interpret market conditions and potential trend shifts.
Why it may be useful
This indicator provides traders with a comprehensive view of market dynamics by simultaneously analyzing price momentum and market positioning through open interest. It helps traders understand not just price movement, but the underlying market sentiment and potential strength of a trend.
By normalizing and visualizing the relationship between price and open interest, traders can gain deeper insights into potential market reversals, trend confirmations, and the overall market psychology driving price action.
When to explore it
The Price OI Division Indicator is most effective when trading futures and perpetual contracts where open interest data is readily available. It works best when aligned with the specific trading timeframe and asset characteristics, requiring careful configuration of fast and slow length parameters.
Traders should use this indicator in conjunction with other technical analysis tools, volume analysis, and support/resistance levels to validate signals and improve overall trading decision-making.
Keep exploring
What we’ve verified
Access, alerts and repainting behaviour have not been independently verified for this indicator. Check the creator’s current publication and settings.
General descriptions and classifications are recovered research. Verified details above identify the specific checks we have completed. Check the creator’s current publication for later changes.


