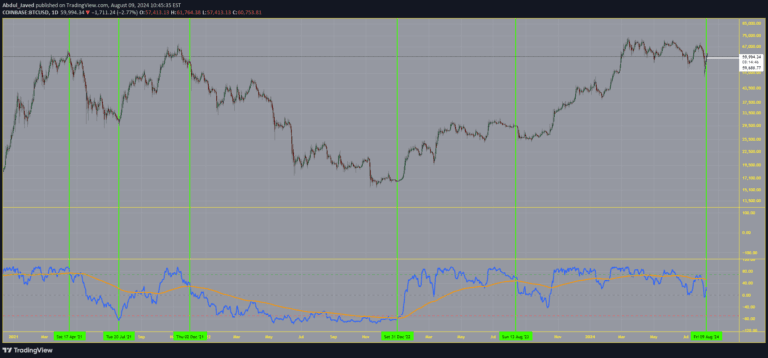
A custom oscillator tracking price movement streaks to identify potential market reversals and overbought/oversold conditions by measuring consecutive price changes and their intensity.
Explore complementary indicator rolesHow it works
The 'Pulse of Cycle' oscillator calculates price movement by adding +1 when prices rise, subtracting -1 when prices fall, and tracking zero when prices remain unchanged. It incorporates a decay factor that multiplies previous values by a constant (like 0.9) to prevent excessive growth and maintain focus on recent price action.
The oscillator moves around a zero line, with specific threshold levels at ±5 and ±10 indicating different market conditions. By tracking the 'rhythm' of price streaks, it provides visual cues through color-coded zones that help traders quickly interpret market momentum and potential reversal points.
Why it may be useful
This oscillator offers traders a unique perspective on market momentum by focusing on price direction streaks rather than traditional price movement magnitude. It provides clear, visual signals that help identify potential market turning points and assess the strength of current price trends with intuitive color-coded zones.
By simplifying complex price action into an easily interpretable format, the 'Pulse of Cycle' helps traders make more informed decisions about market entry and exit points. Its adaptive design allows traders to quickly gauge market sentiment and potential reversal opportunities across different financial instruments.
When to explore it
The 'Pulse of Cycle' oscillator works best in range-bound or sideways markets where price movements are less directional and more cyclical. Traders should look for signals when the oscillator crosses key thresholds, particularly when it moves from extreme zones (above +10 or below -10) back toward the neutral center.
It is most effective when combined with other technical analysis tools like support/resistance levels or candlestick patterns. Traders should be cautious during strong trending markets, where the oscillator's signals might be less reliable, and always implement proper risk management strategies like setting stop-loss orders.
Keep exploring
What we’ve verified
Access, alerts and repainting behaviour have not been independently verified for this indicator. Check the creator’s current publication and settings.
General descriptions and classifications are recovered research. Verified details above identify the specific checks we have completed. Check the creator’s current publication for later changes.