A trading script that tracks new lows and calculates percentage differences to help traders anticipate potential price drops and market movements.
Explore complementary indicator rolesHow it works
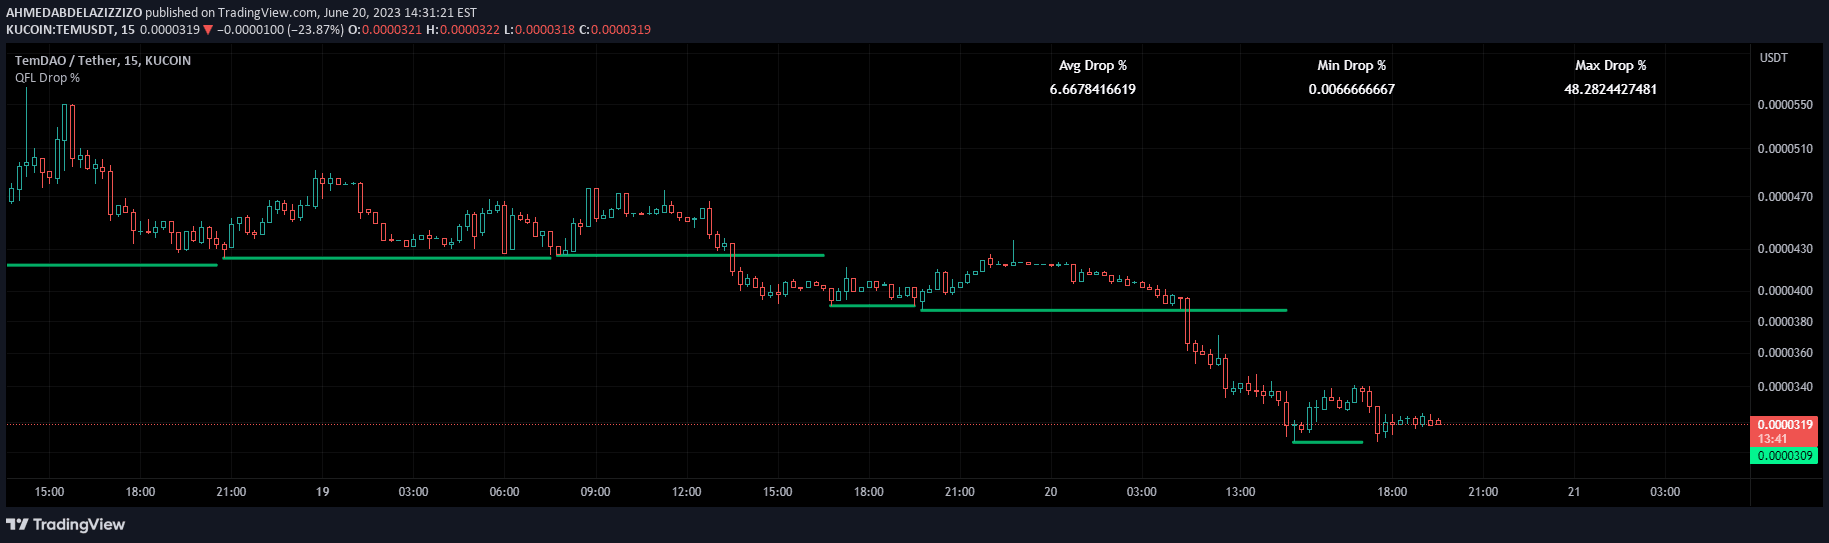
The script actively monitors price action by identifying new low points that are lower than previous lows. When a new low is detected, it calculates the percentage difference between the current and previous low points and stores these percentages in an array for further analysis.
By tracking these percentage differences, the script computes key statistical metrics including the average percentage drop, maximum percentage drop, and minimum percentage drop. These calculated values are then visually displayed on the trading chart, providing traders with a clear visual representation of potential price movement patterns.
Why it may be useful
This trading signal helps traders understand the potential magnitude and consistency of price drops by providing a systematic approach to analyzing low point variations. By quantifying percentage differences between successive low points, traders can gain insights into the market's downward momentum and potential support levels.
The script's ability to calculate and display average, maximum, and minimum percentage drops enables traders to make more informed decisions about potential entry and exit points. This data-driven approach provides a structured method for assessing market volatility and potential price movement scenarios.
When to explore it
The signal is most effective in markets experiencing significant price volatility and pronounced downward trends. Traders can utilize this script during periods of market uncertainty or when analyzing historical price data to identify potential future price drop patterns.
It is particularly useful for traders focusing on short-term trading strategies such as scalping and day trading, where understanding rapid price movements and potential support levels is crucial. The script can help traders anticipate potential market reversals and make more strategic trading decisions based on quantitative analysis of price drop percentages.
Keep exploring
What we’ve verified
Access, alerts and repainting behaviour have not been independently verified for this indicator. Check the creator’s current publication and settings.
General descriptions and classifications are recovered research. Verified details above identify the specific checks we have completed. Check the creator’s current publication for later changes.