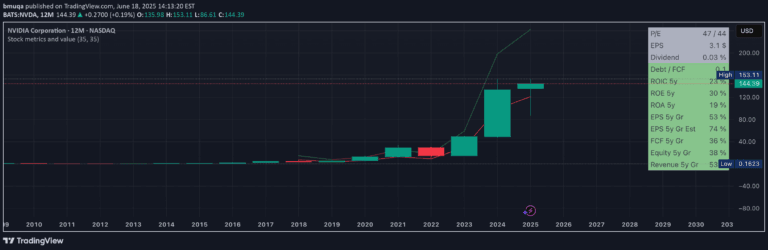
A trading signal that displays quarterly financial metrics like Sales, PAT, and Operating Profit Margin directly on price charts to help traders analyze fundamental growth trends.
Explore complementary indicator rolesHow it works
The indicator automatically retrieves quarterly financial data using TradingView's request.financial() function, focusing on key metrics like Total Revenue, Net Income, and Operating Income. It calculates quarter-over-quarter percentage changes for Sales and Profit After Tax, providing a direct numerical representation of a company's financial performance.
The signal then computes the Operating Profit Margin by dividing Operating Profit by Sales and multiplying by 100, creating a percentage metric that reveals the company's operational efficiency. These calculations are plotted directly on the price chart, allowing traders to seamlessly integrate fundamental analysis with technical price movements.
Why it may be useful
Financial metrics offer crucial insights into a company's underlying health and growth potential, moving beyond pure price action to understand fundamental performance. By presenting these metrics directly on the price chart, traders can quickly assess whether a stock's price movement aligns with its underlying financial strength and momentum.
The ability to see Sales growth, Profit After Tax changes, and Operating Profit Margin in real-time enables traders to make more informed decisions. These metrics help identify companies with consistent growth, strong operational efficiency, and potential for future price appreciation.
When to explore it
This signal is most effective for swing traders and investors interested in fundamental analysis alongside technical trading strategies. It works best when analyzing stocks with consistent quarterly reporting and those in sectors with predictable revenue cycles like technology, consumer goods, and financial services.
Traders should use this indicator during earnings seasons or when preparing for long-term investment decisions. It is particularly useful for identifying stocks with strong, consistent financial performance and those showing potential for sustained growth across multiple quarters.
Keep exploring
What we’ve verified
Access, alerts and repainting behaviour have not been independently verified for this indicator. Check the creator’s current publication and settings.
General descriptions and classifications are recovered research. Verified details above identify the specific checks we have completed. Check the creator’s current publication for later changes.