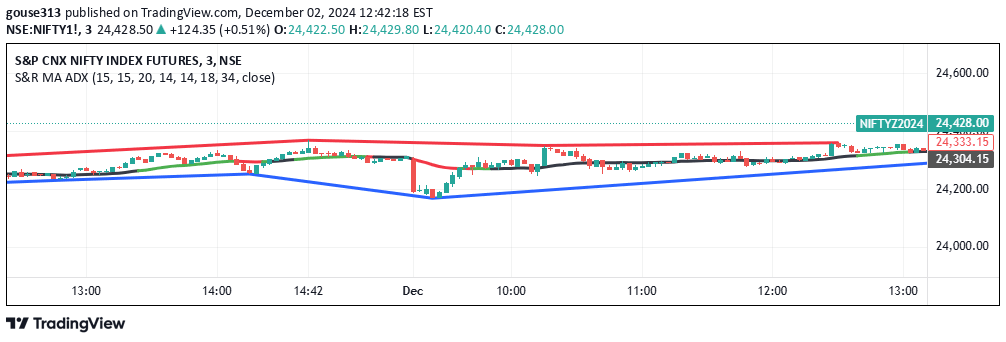
The Quadratic Moving Average (QMA) is an advanced smoothing indicator that provides a unique, responsive trend analysis by applying a multi-layered weighted moving average approach.
Explore complementary indicator rolesHow it works
The QMA calculates a moving average through a sophisticated multi-step process involving weighted moving averages. Initially, it computes a basic weighted moving average over half the specified period, then subtracts the WMA over the full period to emphasize recent price changes.
The resulting value is then re-smoothed using another weighted moving average applied over the square root of the specified length. This quadratic enhancement allows the indicator to provide a more nuanced and responsive representation of price movements compared to traditional moving averages.
Why it may be useful
The QMA offers traders a more sophisticated approach to trend analysis by providing enhanced smoothing and responsiveness to price changes. Its unique calculation method helps reduce market noise while maintaining sensitivity to recent price movements, making it a valuable tool for traders seeking more refined trend identification.
By emphasizing recent price dynamics and applying multiple layers of weighted averaging, the QMA can help traders make more informed decisions about potential trend directions and potential entry or exit points in various market conditions.
When to explore it
The QMA is most effective in markets with significant price volatility where traditional moving averages might generate less precise signals. Traders can utilize this indicator when they want a more responsive trend analysis that captures subtle price movements more effectively than standard moving average techniques.
It works particularly well when combined with other technical analysis tools like volume indicators or momentum oscillators, allowing traders to confirm trends and reduce the likelihood of false signals across different timeframes and market conditions.
Keep exploring
What we’ve verified
Access, alerts and repainting behaviour have not been independently verified for this indicator. Check the creator’s current publication and settings.
General descriptions and classifications are recovered research. Verified details above identify the specific checks we have completed. Check the creator’s current publication for later changes.