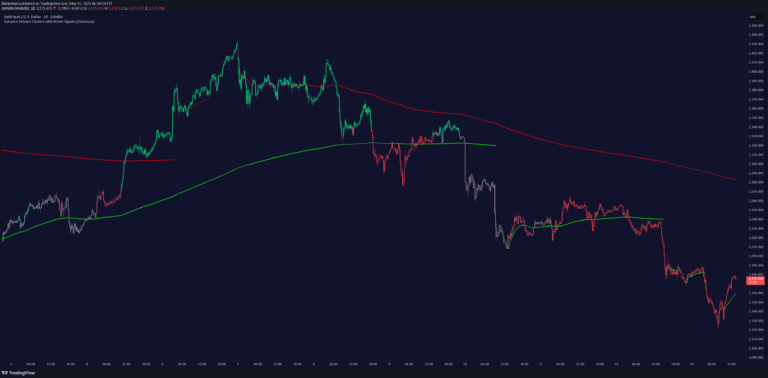
A trading indicator analyzing price expansion and contraction relative to a moving average, tracking price ranges and providing statistical insights into market movement and potential trend shifts.
Explore complementary indicator rolesHow it works
The indicator tracks price movement relative to a moving average by analyzing expansion and contraction phases. It calculates the maximum distance between price and the moving average and generates proportional levels to categorize price ranges.
For each range, the indicator counts and calculates the percentage of bars that reached specific distance levels. It allows traders to configure the moving average type, period, and analysis direction, providing a comprehensive view of price behavior around the moving average.
Why it may be useful
This indicator offers traders quantitative insights into market dynamics by transforming price movement into measurable statistical data. It helps traders understand market volatility, momentum, and potential trend strength through precise range percentage analysis.
By converting abstract price movements into concrete percentages, traders can make more objective decisions. The indicator provides a systematic approach to understanding market conditions, allowing for more disciplined trading strategies and reducing emotional decision-making.
When to explore it
The indicator works best in markets with clear directional movements and consistent trends where price ranges can be meaningfully analyzed. It is particularly useful during periods of established market momentum where price consistently moves away from or returns to the moving average.
Traders should employ this indicator when seeking to validate trend strength, identify potential entry and exit points, and assess market volatility. It is especially valuable for traders looking to develop a more statistical and data-driven approach to market analysis.
Keep exploring
What we’ve verified
Access, alerts and repainting behaviour have not been independently verified for this indicator. Check the creator’s current publication and settings.
General descriptions and classifications are recovered research. Verified details above identify the specific checks we have completed. Check the creator’s current publication for later changes.