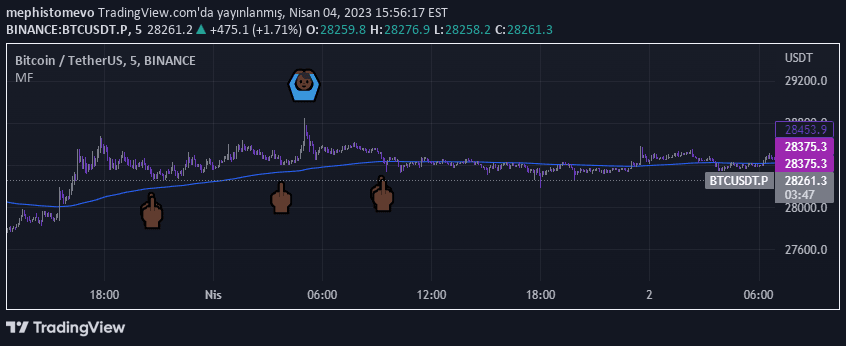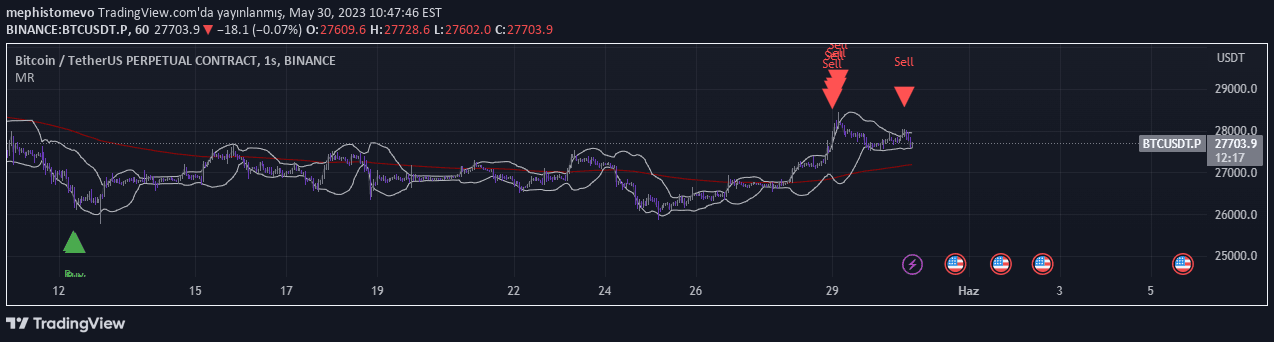
A mean reversion trading strategy that identifies potential buy and sell opportunities by analyzing price deviations from the exponential moving average using ATR and Bollinger Bands.
Explore complementary indicator rolesHow it works
The Mean Reversion indicator operates by calculating the distance between the current price and the Exponential Moving Average (EMA) using the Average True Range (ATR). By multiplying the ATR by a specified factor, the script establishes a volatility-based threshold for price deviation.
When the price falls below the EMA by the ATR distance and drops below the lower Bollinger Band, a buy signal is generated. Conversely, when the price rises above the EMA by the ATR distance and moves above the upper Bollinger Band, a sell signal is triggered, suggesting potential price reversion to the mean.
Why it may be useful
Mean Reversion strategies are crucial for traders because they capitalize on the statistical tendency of prices to return to their average over time. By identifying periods of potential overextension, traders can make more informed decisions about market entry and exit points.
The combination of ATR and Bollinger Bands provides a robust framework for understanding market volatility and potential price corrections. This approach helps traders manage risk by signaling when an asset might be temporarily undervalued or overvalued, offering strategic opportunities for trade execution.
When to explore it
This indicator works best in markets that demonstrate consistent mean-reverting behavior, such as range-bound or sideways trending markets. It is particularly effective in highly liquid and less volatile assets where price movements are more predictable and less prone to extreme directional shifts.
Traders should apply this strategy during periods of moderate market volatility and when there are clear support and resistance levels. It is most suitable for traders who prefer a systematic approach to identifying potential entry and exit points based on statistical price deviation and volatility measurements.
Keep exploring
What we’ve verified
Access, alerts and repainting behaviour have not been independently verified for this indicator. Check the creator’s current publication and settings.
General descriptions and classifications are recovered research. Verified details above identify the specific checks we have completed. Check the creator’s current publication for later changes.