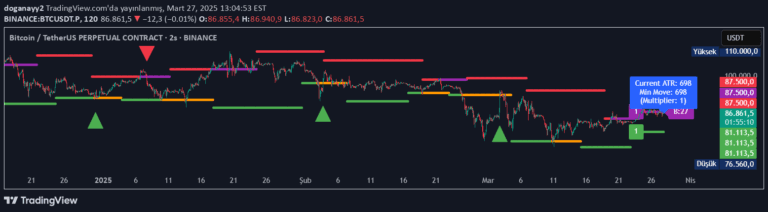
An adaptive trendline indicator using Average True Range (ATR) to create dynamic support and resistance zones with multi-level matrix projections for trend analysis.
Explore complementary indicator rolesHow it works
The ATR Trend Matrix begins by detecting key swing points in the market, identifying significant highs and lows based on a predefined swing length. It then calculates dynamic trendlines using Average True Range (ATR) with customizable multipliers, creating up to four matrix levels that adapt to market volatility.
As price moves, the indicator automatically updates and manages these trendlines, with an optional auto-adjust mode that allows real-time modifications based on changing ATR values. The system marks potential trade signals when price interacts with the primary matrix level, providing traders with visual cues for potential entry and exit points.
Why it may be useful
The ATR Trend Matrix offers traders a sophisticated approach to understanding market structure by integrating volatility analysis directly into trendline calculations. By using ATR as a foundation, the indicator provides a more dynamic and responsive method of identifying support and resistance zones compared to traditional static trendline techniques.
This approach allows traders to adapt to changing market conditions, with the multi-level matrix system offering insights into potential trend strength, breakout opportunities, and market volatility. The indicator's flexibility makes it a powerful tool for traders seeking a more nuanced understanding of price action and market dynamics.
When to explore it
The ATR Trend Matrix is most effective in markets with clear directional movement and moderate to high volatility, where traditional trendline methods might fall short. It excels in capturing trend changes and providing early signals in both trending and ranging market conditions, making it versatile across different trading environments.
Traders can particularly benefit from this indicator when analyzing assets with significant price fluctuations, such as cryptocurrencies, forex pairs, and volatile stock indices. Its adaptive nature makes it especially useful during periods of market transition, helping traders identify potential trend reversals and breakout opportunities with greater precision.
Keep exploring
What we’ve verified
Access, alerts and repainting behaviour have not been independently verified for this indicator. Check the creator’s current publication and settings.
General descriptions and classifications are recovered research. Verified details above identify the specific checks we have completed. Check the creator’s current publication for later changes.