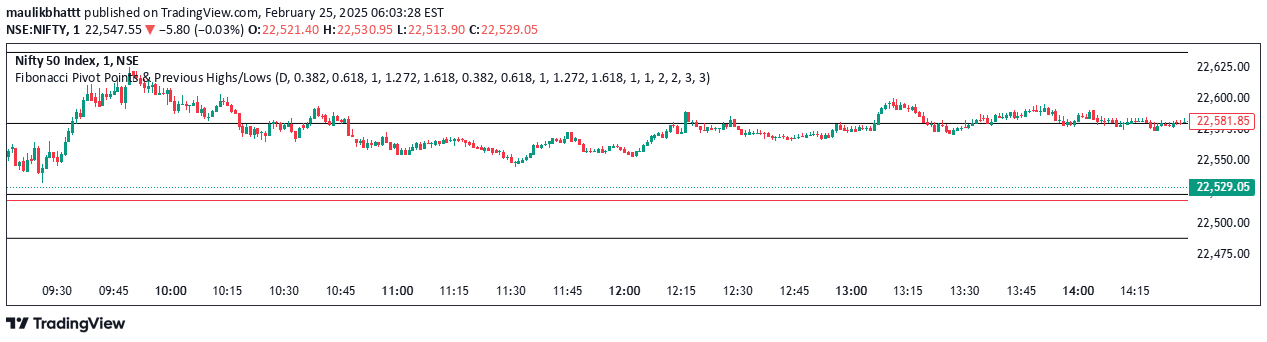
A Fibonacci level indicator that automatically draws dynamic levels on different timeframes like Monday, Monthly, or Quarterly for technical analysis and price level identification.
Explore complementary indicator rolesHow it works
The Fibonacci level indicator generates automatic levels based on selected timeframes like Monday, Monthly, or Quarterly. It plots predefined Fibonacci levels including 0, 0.25, 0.5, 0.75, and 1, creating a structured visual representation of potential price zones.
These levels are dynamically drawn on the chart, allowing traders to quickly identify potential support and resistance areas. The indicator offers additional customization features like displaying titles on the top right of each line and showing dashed lines between levels for enhanced visualization.
Why it may be useful
Fibonacci levels provide traders with critical insights into potential price reversal or continuation zones based on mathematical ratios. These levels help identify key psychological price points where market participants might potentially enter or exit trades.
By offering automated plotting across different timeframes, this indicator simplifies complex technical analysis. Traders can quickly gauge potential market movements and make more informed decisions about entry, exit, and risk management strategies.
When to explore it
This Fibonacci level indicator is most effective during trending markets with clear directional movements. Traders can use it to identify potential support and resistance zones, helping to confirm entry and exit points for various trading strategies.
It is particularly useful for traders seeking to understand potential price retracements and extensions across different timeframes. The versatility of selecting Monday, Monthly, or Quarterly perspectives allows for flexible analysis adaptable to various trading styles and market conditions.
Keep exploring
What we’ve verified
Access, alerts and repainting behaviour have not been independently verified for this indicator. Check the creator’s current publication and settings.
General descriptions and classifications are recovered research. Verified details above identify the specific checks we have completed. Check the creator’s current publication for later changes.