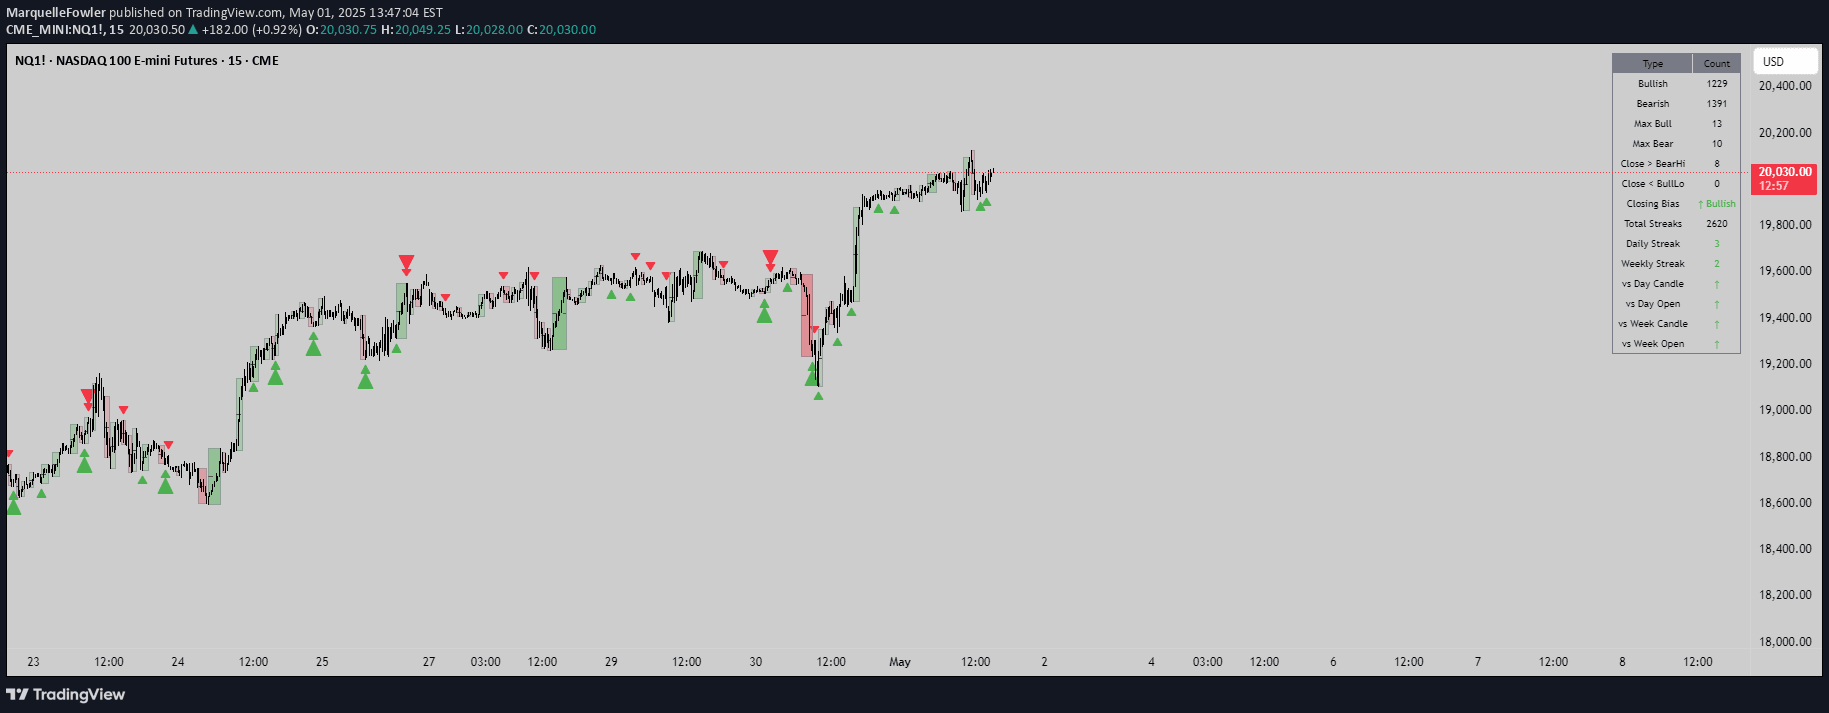
A complex trading signal analyzing consecutive candle ranges, color bar patterns, and swing filters to identify market conditions and potential trading opportunities.
Explore complementary indicator rolesHow it works
The signal begins by examining consecutive candle range boxes with gradient and number count, tracking the market's order flow dynamics. It evaluates inside, outside, and engulfing color bars to understand price action patterns and potential trend shifts.
A strict swing filter is applied, with an additional bonus filter that checks the third bar in the swing, ensuring it closes below the swing candles' high or low. This multi-layered approach helps traders identify more nuanced market movements and potential entry or exit points.
Why it may be useful
By combining multiple analytical techniques, this signal provides traders with a comprehensive view of market conditions beyond traditional single-indicator approaches. It helps identify subtle price action shifts and potential trend reversals that might be missed by more simplistic trading methods.
The signal's flexibility across different trading timeframes makes it valuable for various trading styles, from scalping to swing trading. Its intricate filtering mechanism reduces false signals and helps traders make more informed decisions based on complex market dynamics.
When to explore it
This signal is most effective in markets with clear price action and distinct candle formations, such as forex, stocks, and futures trading. It works best in moderately volatile markets where price movements are deliberate and patterns are more easily recognizable.
Traders should apply this signal during active trading hours when market liquidity is high and price movements are more predictable. It is particularly useful during trending market conditions where consecutive candle ranges and swing filters can provide meaningful insights into potential trade opportunities.
Keep exploring
What we’ve verified
Access, alerts and repainting behaviour have not been independently verified for this indicator. Check the creator’s current publication and settings.
General descriptions and classifications are recovered research. Verified details above identify the specific checks we have completed. Check the creator’s current publication for later changes.