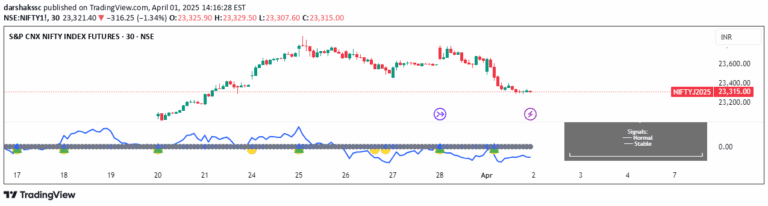
A signal tracking the realized price of cryptocurrencies by calculating the average price of coin supply based on historical transactions, revealing potential market bottoms.
Explore complementary indicator rolesHow it works
The realized price is calculated by dividing the realized market capitalization by the total circulating supply of a cryptocurrency. It represents the average price at which all coins were last moved on-chain, effectively showing the market's cost basis.
By comparing the current market price to the realized price, traders can identify potential market bottoms when the current price falls below the realized price. This metric uses the Market Value to Realized Value (MVRV) ratio, which compares the current market capitalization to the total value of coins at their last transaction price.
Why it may be useful
The realized price provides a unique on-chain perspective of cryptocurrency market valuation, offering insights beyond traditional price analysis. It helps traders understand the aggregate cost basis of all holders, revealing potential support levels and market sentiment.
By identifying when market prices drop below the realized price, investors can gauge potential market bottoms and make more informed entry decisions. This metric is particularly valuable in volatile cryptocurrency markets, where understanding long-term holder behavior can provide critical trading insights.
When to explore it
The realized price signal is most effective during significant market corrections and potential trend reversals in cryptocurrencies like Bitcoin, Ethereum, and Litecoin. It works best when analyzing longer-term market cycles and identifying potential accumulation zones.
Traders should use this signal as part of a comprehensive analysis, combining it with other technical and on-chain indicators. It is particularly useful for swing traders and long-term investors looking to identify potential low-risk entry points during market downturns.
Keep exploring
What we’ve verified
Access, alerts and repainting behaviour have not been independently verified for this indicator. Check the creator’s current publication and settings.
General descriptions and classifications are recovered research. Verified details above identify the specific checks we have completed. Check the creator’s current publication for later changes.