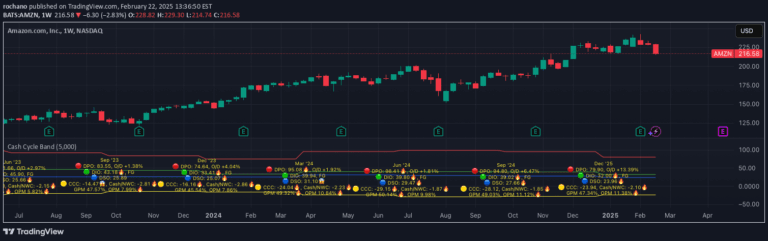
PFCF Price Band evaluates a stock's valuation by comparing current price to free cash flow per share, helping traders identify potentially cheap or expensive stocks.
Explore complementary indicator rolesHow it works
The PFCF Price Band calculates a stock's valuation by comparing its current price to free cash flow per share (FCFPS) over the last 12 months. It creates two key visual components: a color-coded band representing historical P/FCFPS values and a blue line showing the current price-to-free cash flow ratio.
When the TTM FCFPS is positive, the band turns green, and when negative, it turns red. The indicator helps traders understand the stock's current valuation by tracking how the current price relates to the company's free cash flow generation, similar to how price-to-earnings ratios work.
Why it may be useful
The PFCF Price Band provides crucial insights into a company's financial health by focusing on free cash flow, which is often a more reliable indicator of a company's true financial strength than net profit. It helps investors distinguish between truly valuable stocks and those that may appear attractive but lack substantial cash flow.
By comparing current pricing to free cash flow, traders can identify potentially undervalued or overvalued stocks, making more informed investment decisions. This approach offers a deeper understanding of a company's financial performance beyond surface-level earnings metrics.
When to explore it
The PFCF Price Band is most effective when analyzing stocks for medium to long-term investment opportunities, particularly for value investors seeking fundamentally sound companies. It works best when used in conjunction with other fundamental analysis tools, especially the PE Band indicator, to get a comprehensive view of a company's financial health.
Traders should pay special attention to stocks where the current P/FCFPS is lower than historical minimums, as this might indicate a potentially undervalued stock. Conversely, prices above historical maximums could signal an overvalued stock that might be due for a correction.
Keep exploring
What we’ve verified
Access, alerts and repainting behaviour have not been independently verified for this indicator. Check the creator’s current publication and settings.
General descriptions and classifications are recovered research. Verified details above identify the specific checks we have completed. Check the creator’s current publication for later changes.