
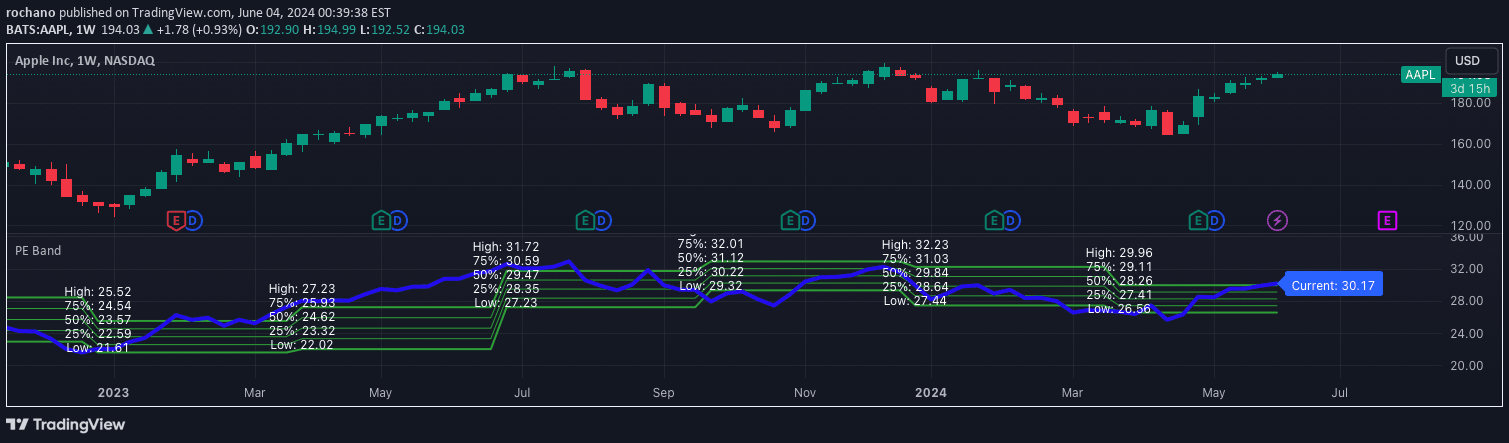
PE Band is a valuation indicator that tracks price-to-earnings ratios over time, identifying when a stock is potentially cheap or expensive based on historical P/E ranges.
Explore complementary indicator rolesHow it works
The PE Band indicator calculates two primary lines to analyze a stock's valuation over time. The first line represents historical P/E values, color-coded green for positive TTM EPS and red for negative TTM EPS, tracking the highest and lowest P/E levels during specific periods.
The second line, colored blue, represents the current P/E ratio by dividing the closing price by the trailing twelve-month earnings per share (TTM EPS). By comparing the current P/E to historical ranges, traders can assess whether a stock is potentially undervalued or overvalued at its current price point.
Why it may be useful
The PE Band provides investors with a critical perspective on a stock's valuation relative to its historical performance, helping them make more informed investment decisions. By highlighting periods when a stock is trading below or above its typical P/E range, the indicator offers insights into potential buying or selling opportunities.
Understanding a stock's valuation through P/E ratios can help investors identify potential market inefficiencies and make more strategic long-term investment choices. The indicator allows traders to contextualize current pricing against historical earnings performance, providing a nuanced view of a stock's potential value.
When to explore it
The PE Band is most effective for investors focusing on fundamental analysis and long-term investment strategies, particularly when evaluating stocks with consistent earnings histories. It works best in markets with stable economic conditions where historical earnings patterns can provide meaningful insights.
Investors should use the PE Band in conjunction with other fundamental and technical analysis tools to validate potential investment opportunities. The indicator is particularly useful when analyzing stocks in sectors with predictable earnings cycles or when comparing a stock's current valuation to its historical performance.
Keep exploring
What we’ve verified
Access, alerts and repainting behaviour have not been independently verified for this indicator. Check the creator’s current publication and settings.
General descriptions and classifications are recovered research. Verified details above identify the specific checks we have completed. Check the creator’s current publication for later changes.


