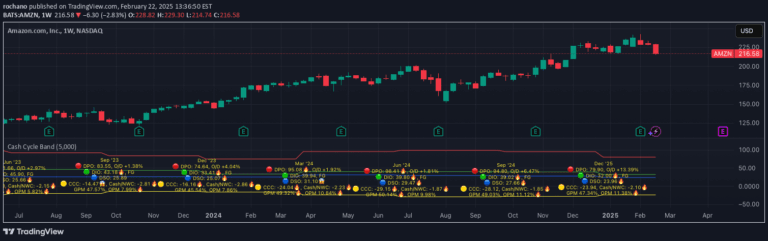
ROE Band breaks down a company's financial performance by analyzing return on equity through multiple financial leverage components to assess profitability and operational efficiency.
Explore complementary indicator rolesHow it works
The ROE Band calculates financial performance by decomposing Return on Equity (ROE) into five critical components: TTM ROE, quarterly ROE, Return on Assets (ROA), Capital Structure Leverage (CSL), and Common Earnings Leverage (CEL). Each component is calculated using specific financial metrics that track how efficiently a company generates profits from shareholders' equity.
By analyzing these interconnected financial ratios, traders can understand the underlying drivers of a company's profitability. The method breaks down complex financial performance into color-coded and emoji-represented metrics, making it easier to interpret the nuanced aspects of a company's financial health and operational effectiveness.
Why it may be useful
The ROE Band provides traders and investors with a comprehensive view of a company's financial performance beyond simple profit numbers. It reveals how effectively management uses shareholders' equity, debt leverage, and operational efficiency to generate returns, offering insights into the company's strategic financial management.
By decomposing ROE into specific components, investors can identify potential strengths and weaknesses in a company's financial structure. This granular analysis helps in making more informed investment decisions, understanding risk factors, and evaluating a company's potential for sustainable growth and profitability.
When to explore it
The ROE Band is most useful when conducting fundamental analysis of stocks, particularly when comparing companies within the same industry or evaluating a company's financial performance over time. It is especially valuable during quarterly earnings reports and when assessing long-term investment potential.
Traders and investors should use this method when they want to dig deeper than surface-level financial metrics and understand the intricate mechanisms driving a company's profitability. It is particularly effective for swing trading strategies that require a more nuanced understanding of a company's financial health and potential for sustained growth.
Keep exploring
What we’ve verified
Access, alerts and repainting behaviour have not been independently verified for this indicator. Check the creator’s current publication and settings.
General descriptions and classifications are recovered research. Verified details above identify the specific checks we have completed. Check the creator’s current publication for later changes.