PE Band
PE Band is a valuation indicator that tracks price-to-earnings ratios over time, identifying when a stock is potentially cheap or expensive based on historical P/E ranges.
Explore 11,183 indicators. Filter beyond the obvious.
Discover the tools that fit the way you trade.
11,183 tools to explore
PE Band is a valuation indicator that tracks price-to-earnings ratios over time, identifying when a stock is potentially cheap or expensive based on historical P/E ranges.
PFCF Price Band evaluates a stock's valuation by comparing current price to free cash flow per share, helping traders identify potentially cheap or expensive stocks.
PEV Price Band analyzes the relationship between market capitalization and enterprise value to identify potentially undervalued or overvalued stocks using price bands.
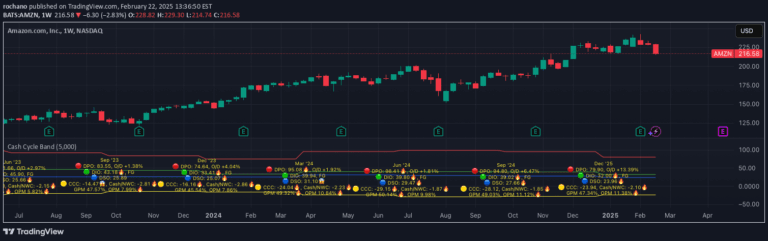
Cash cycle band analyzes how efficiently a company manages its working capital by tracking days of payables, inventory, sales outstanding, and conversion metrics.
ROE Band breaks down a company's financial performance by analyzing return on equity through multiple financial leverage components to assess profitability and operational efficiency.
Likes, views, and comments are historical TradingView snapshots. They describe attention, not trading performance.