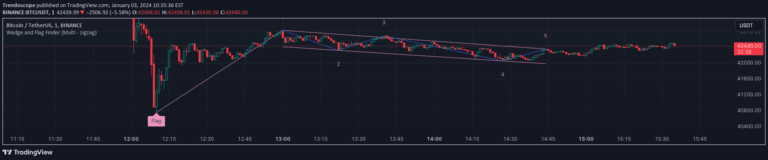
A comprehensive indicator that scans and highlights multiple reversal chart patterns like Double Tops, Cup and Handles, and Head and Shoulders using recursive zigzag analysis.
Explore complementary indicator rolesHow it works
The Recursive Reversal Chart Patterns Indicator uses recursive zigzag techniques to identify and highlight potential reversal patterns on price charts. It analyzes price movements to detect specific formations such as Double Tops, Double Bottoms, Triple Tops, Triple Bottoms, Cup and Handle, and Head and Shoulders patterns.
The algorithm recursively breaks down price action into zigzag components, comparing them against predefined pattern criteria. By systematically examining price structures, the indicator can automatically recognize and label these significant chart patterns that often signal potential trend reversals or continuations
Why it may be useful
Chart patterns are crucial for traders as they provide visual insights into potential market sentiment shifts and price action dynamics. By automatically identifying these patterns, traders can quickly recognize potential trend reversals or continuation signals without manual chart analysis.
The indicator reduces subjective interpretation by using a systematic approach to pattern recognition. It helps traders make more informed decisions by highlighting statistically significant price formations that might indicate upcoming market movements. This systematic approach can improve trade entry and exit timing and enhance overall technical analysis strategies
When to explore it
This indicator works best in markets with clear trending behavior and sufficient price volatility. It is most effective on timeframes that allow clear pattern formation, such as daily or weekly charts for swing trading. Traders should use it as a complementary tool alongside other technical indicators for confirmation.
It is particularly useful during consolidation periods or when markets show potential reversal signals. The indicator can be applied across various financial instruments like stocks, forex, and cryptocurrencies. Traders should combine its signals with additional technical and fundamental analysis for more reliable trading decisions
Keep exploring
What we’ve verified
Access, alerts and repainting behaviour have not been independently verified for this indicator. Check the creator’s current publication and settings.
General descriptions and classifications are recovered research. Verified details above identify the specific checks we have completed. Check the creator’s current publication for later changes.