
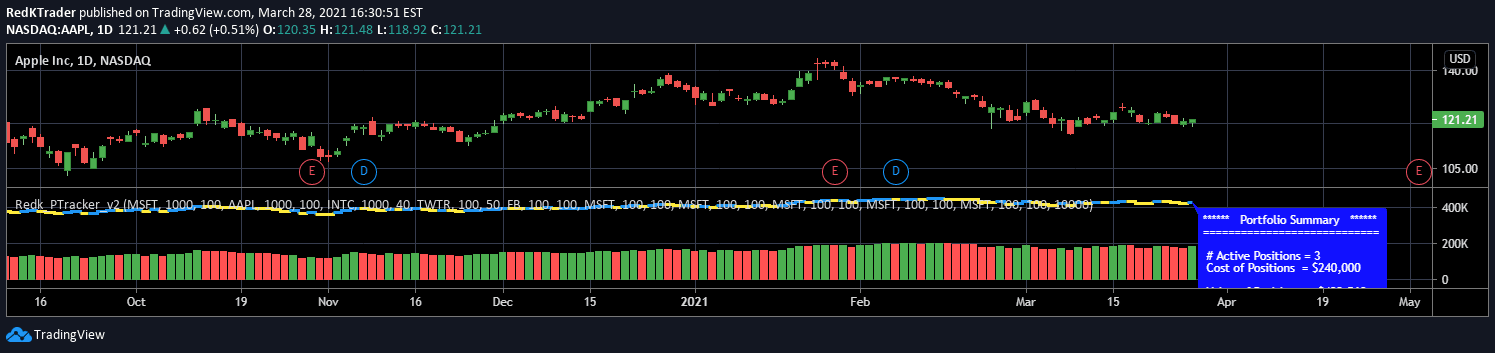
Portfolio Tracker is a TradingView tool that helps traders monitor their investment portfolio's performance, including positions, total profit/loss, and cash allocation directly on price charts.
Explore complementary indicator rolesHow it works
The Portfolio Tracker allows traders to input multiple stock positions by symbol and quantity, calculating total portfolio value, cost basis, and performance metrics. Users can track up to ten different positions and include free cash in their overall portfolio calculation.
The tool generates a summary infobox that displays key financial information, which can be positioned either in a separate panel or directly on the price chart for easy reference. Traders can customize the display settings, including color and scale options
Why it may be useful
Portfolio tracking is crucial for investors to maintain a comprehensive view of their investment performance. This tool provides real-time insights into portfolio composition, helping traders make informed decisions about asset allocation and potential adjustments.
By offering a consolidated view of multiple positions, investors can quickly assess overall portfolio health, track gains and losses, and understand the impact of individual stock movements on total portfolio value. The flexible display options make it easy to integrate portfolio monitoring into existing trading workflows
When to explore it
The Portfolio Tracker is most beneficial for active traders managing multiple stock positions across different timeframes. It is particularly useful for swing traders and day traders who need to monitor their investments continuously.
The tool becomes especially valuable during volatile market conditions when rapid portfolio assessment is critical. Investors with diversified portfolios containing stocks from various sectors will find this tracker most helpful. It can assist in making timely rebalancing decisions and providing a quick snapshot of overall investment performance
Keep exploring
What we’ve verified
Access, alerts and repainting behaviour have not been independently verified for this indicator. Check the creator’s current publication and settings.
General descriptions and classifications are recovered research. Verified details above identify the specific checks we have completed. Check the creator’s current publication for later changes.


