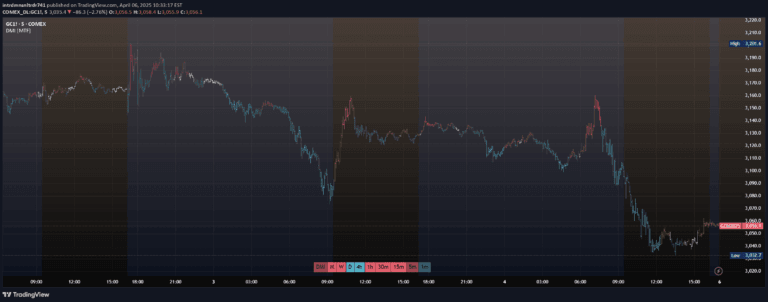
A sophisticated session average indicator that estimates market conditions and direction using advanced extrapolation techniques across different market sessions and weighting schemes.
Explore complementary indicator rolesHow it works
The Relative Average Extrapolation uses a custom indexing system to store and analyze market data at each time step throughout the day. By transforming time (hour/minute) into an array index, it captures current data points and creates a unique market footprint for each session.
The indicator leverages the relative rate of change for average prices, deviation, and price position to extrapolate market conditions from the current point to the end of the session. It offers multiple weighting schemes including volume, time, volatility, and linear, allowing flexible analysis across different market contexts.
Why it may be useful
This indicator provides traders with a predictive tool that can estimate market conditions and potential future movements within a trading session. By analyzing the market's footprint at specific times, it offers insights into potential price trends and volatility that can inform trading decisions.
The unique approach of session-based averaging and extrapolation allows traders to understand market dynamics more comprehensively, potentially revealing patterns and trends that might be missed by traditional indicators. Its adaptability across different weighting schemes makes it a versatile tool for various trading strategies.
When to explore it
The Relative Average Extrapolation works best on intraday timeframes between one minute and a full trading session. It is particularly effective for traders seeking to understand market conditions and potential directional movements within a specific trading period.
The indicator is most suitable for markets with consistent trading patterns and less effective in highly volatile or unpredictable markets like cryptocurrency. Traders should use it in conjunction with other technical analysis tools and adjust its settings to match their specific trading style and market characteristics.
Keep exploring
What we’ve verified
Access, alerts and repainting behaviour have not been independently verified for this indicator. Check the creator’s current publication and settings.
General descriptions and classifications are recovered research. Verified details above identify the specific checks we have completed. Check the creator’s current publication for later changes.