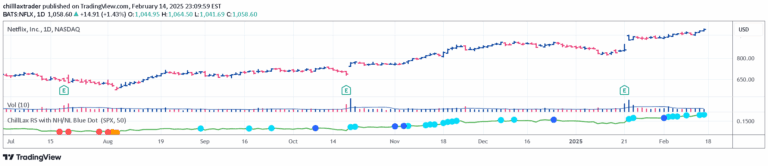
A performance comparison tool that tracks relative price changes of a ticker against an index over multiple timeframes, providing insights into comparative market performance.
Explore complementary indicator rolesHow it works
This performance comparison tool calculates the rate of change for a specific ticker across multiple timeframes including 1 month, 3 months, 6 months, 1 year, and year-to-date. It compares these rates of change against a benchmark index, typically the S&P 500 (SPX).
The tool generates a comparative analysis by computing the relative performance percentages and presenting them in a structured table format. Additionally, it incorporates supplementary metrics like the Average Daily Range (ADR) and the ticker's distance from its 52-week high to provide a comprehensive performance overview.
Why it may be useful
By providing a multi-timeframe performance comparison, this tool helps traders quickly assess a security's relative strength and market performance. It enables investors to understand how a specific ticker is performing compared to a broader market benchmark, offering insights into potential investment opportunities or risks.
The tool's ability to display performance metrics alongside fundamental data creates a holistic view of a security's technical and fundamental characteristics. This comprehensive approach allows traders to make more informed decisions by understanding both the price action and underlying financial health of an investment.
When to explore it
This performance comparison tool is most effective for swing traders and investors seeking a comprehensive view of a security's market performance. It is particularly useful when evaluating potential investments, comparing different securities, or assessing the relative strength of a particular stock against broader market trends.
Traders can leverage this tool during portfolio construction, sector rotation strategies, or when conducting comparative analysis across different market segments. Its flexibility in comparing various timeframes makes it valuable for both short-term tactical and long-term strategic investment decision-making.
Keep exploring
What we’ve verified
Access, alerts and repainting behaviour have not been independently verified for this indicator. Check the creator’s current publication and settings.
General descriptions and classifications are recovered research. Verified details above identify the specific checks we have completed. Check the creator’s current publication for later changes.