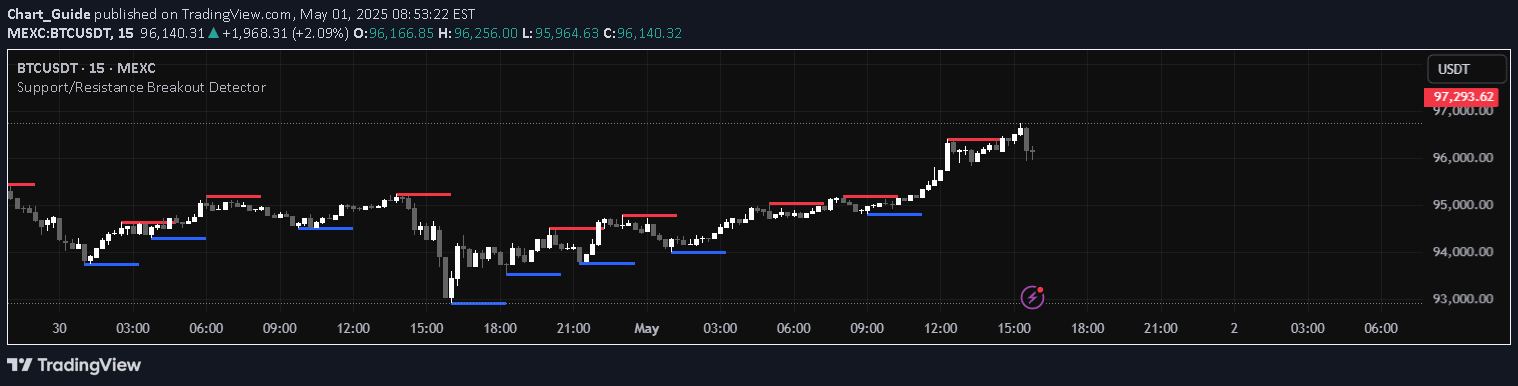
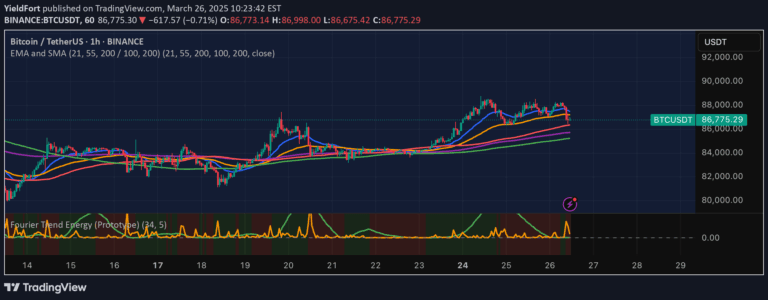
A dynamic spiral visualization tool that generates geometric patterns on price charts, allowing traders to map price movements through a unique rotational representation with customizable parameters.
Explore complementary indicator rolesHow it works
The spiral is dynamically centered on the chart's closing price, with an optional vertical offset to adjust its positioning. The spiral is constructed using trigonometric calculations, where each turn is divided into multiple segments determined by the segments_per_turn parameter.
The spiral's geometry is controlled by key parameters like spacing, which defines radial distance between turns, and num_turns, which determines total rotational cycles. By computing segment endpoints using cosine and sine functions, the indicator creates a smooth, mathematically precise visual representation of price movement.
Why it may be useful
The spiral visualization offers traders a unique perspective on price dynamics, transforming traditional linear price data into a geometrically intricate representation. This novel approach can help identify subtle patterns and trends that might be less apparent in conventional chart analysis.
By providing a different visual framework, traders can potentially gain insights into market movement that standard linear charts might obscure. The customizable nature of the spiral allows for flexible adaptation to different trading styles and market conditions.
When to explore it
This spiral visualization is most effective in markets with clear directional movements and during periods of consistent trend development. It works particularly well in volatile markets where price action shows discernible directional shifts and rhythmic patterns.
Traders should consider using this tool when seeking alternative visual representations of price movement, especially when traditional linear charts fail to provide clear insights. It is particularly useful for traders who appreciate mathematical and geometric approaches to market analysis.
Keep exploring
What we’ve verified
Access, alerts and repainting behaviour have not been independently verified for this indicator. Check the creator’s current publication and settings.
General descriptions and classifications are recovered research. Verified details above identify the specific checks we have completed. Check the creator’s current publication for later changes.