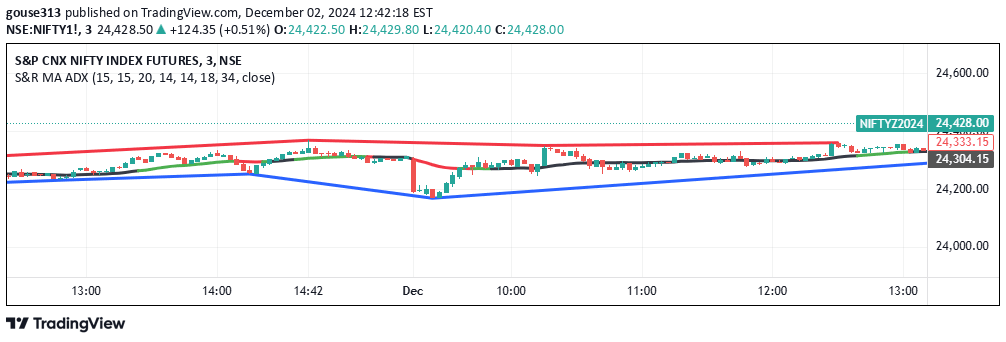
A customizable trading tool allowing manual placement of horizontal price levels on charts to identify and visualize key support, resistance, and static price zones.
Explore complementary indicator rolesHow it works
The RESHA indicator enables traders to manually input specific price levels as horizontal lines on a trading chart. Traders can enter desired prices in a comma-separated format, which are then automatically plotted as customizable lines extending a specified number of candles forward.
Each line represents a critical price zone that traders want to monitor, providing a visual representation of potential support, resistance, or significant price levels. The lines can be adjusted for length and are accompanied by clear price labels, making it easy for traders to track and reference important price points during their analysis.
Why it may be useful
The RESHA indicator provides traders with a flexible and intuitive method to highlight and track critical price levels across different trading timeframes. By allowing manual input of key prices, traders can visually mark zones of potential market interest, which can help in making more informed trading decisions.
This tool is particularly valuable because it transforms abstract price levels into concrete visual markers, enabling traders to quickly identify potential entry, exit, or stop-loss points. The customizable nature of the indicator means traders can adapt it to their specific trading strategy and market interpretation.
When to explore it
The RESHA indicator is most effective when traders have identified specific price levels through technical analysis, fundamental research, or historical price action. It is particularly useful in markets with clear support and resistance zones, or when tracking price levels from previous significant highs, lows, or consolidation areas.
Traders can utilize this tool across various markets and timeframes, from scalping to swing trading, to maintain a consistent visual reference of important price zones. It is especially helpful during ranging markets, breakout scenarios, or when monitoring potential trend reversal levels.
Keep exploring
What we’ve verified
Access, alerts and repainting behaviour have not been independently verified for this indicator. Check the creator’s current publication and settings.
General descriptions and classifications are recovered research. Verified details above identify the specific checks we have completed. Check the creator’s current publication for later changes.