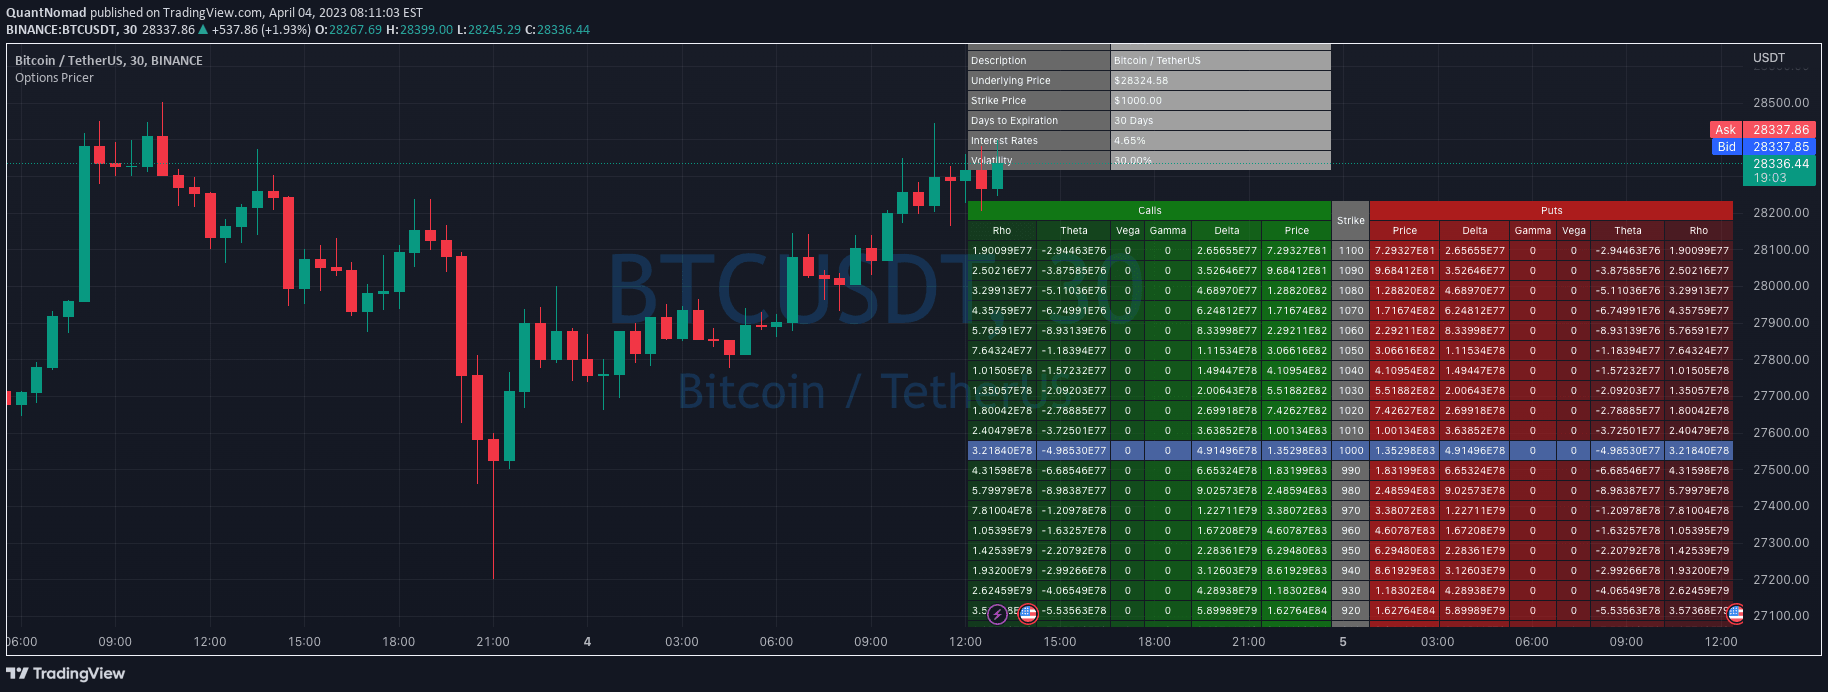
A rolling straddle premium indicator that tracks option strike prices, providing insights into potential trading opportunities by monitoring price changes and premium fluctuations.
Explore complementary indicator rolesHow it works
The rolling straddle premium indicator analyzes option strike prices by tracking the current premium and comparing it to the entry price. It provides key metrics like entry price (EN), current price (Cur), maximum straddle premium increase (SH), and minimum straddle premium erosion (SL).
Traders input the last traded price (LTP) and specify an expiry date for the option strike. The indicator then generates labels and tracks price movements, helping traders understand the potential profitability and risk of their options strategy.
Why it may be useful
Options traders need precise tools to monitor their positions and assess potential profit or loss. This indicator offers real-time insights into straddle premium dynamics, allowing traders to make informed decisions about maintaining or adjusting their options positions.
By providing a clear visualization of premium changes, the indicator helps traders manage risk, understand market volatility, and potentially optimize their options trading strategies across different market conditions.
When to explore it
The rolling straddle premium indicator is most effective during periods of high market volatility or when trading index options. It works best when traders have a clear understanding of the underlying index and can accurately input the last traded price and expiry date.
Traders should use this tool when they want to track short straddle positions, especially around pivot high points, and need a systematic way to monitor premium fluctuations and potential trading opportunities.
Keep exploring
What we’ve verified
Access, alerts and repainting behaviour have not been independently verified for this indicator. Check the creator’s current publication and settings.
General descriptions and classifications are recovered research. Verified details above identify the specific checks we have completed. Check the creator’s current publication for later changes.