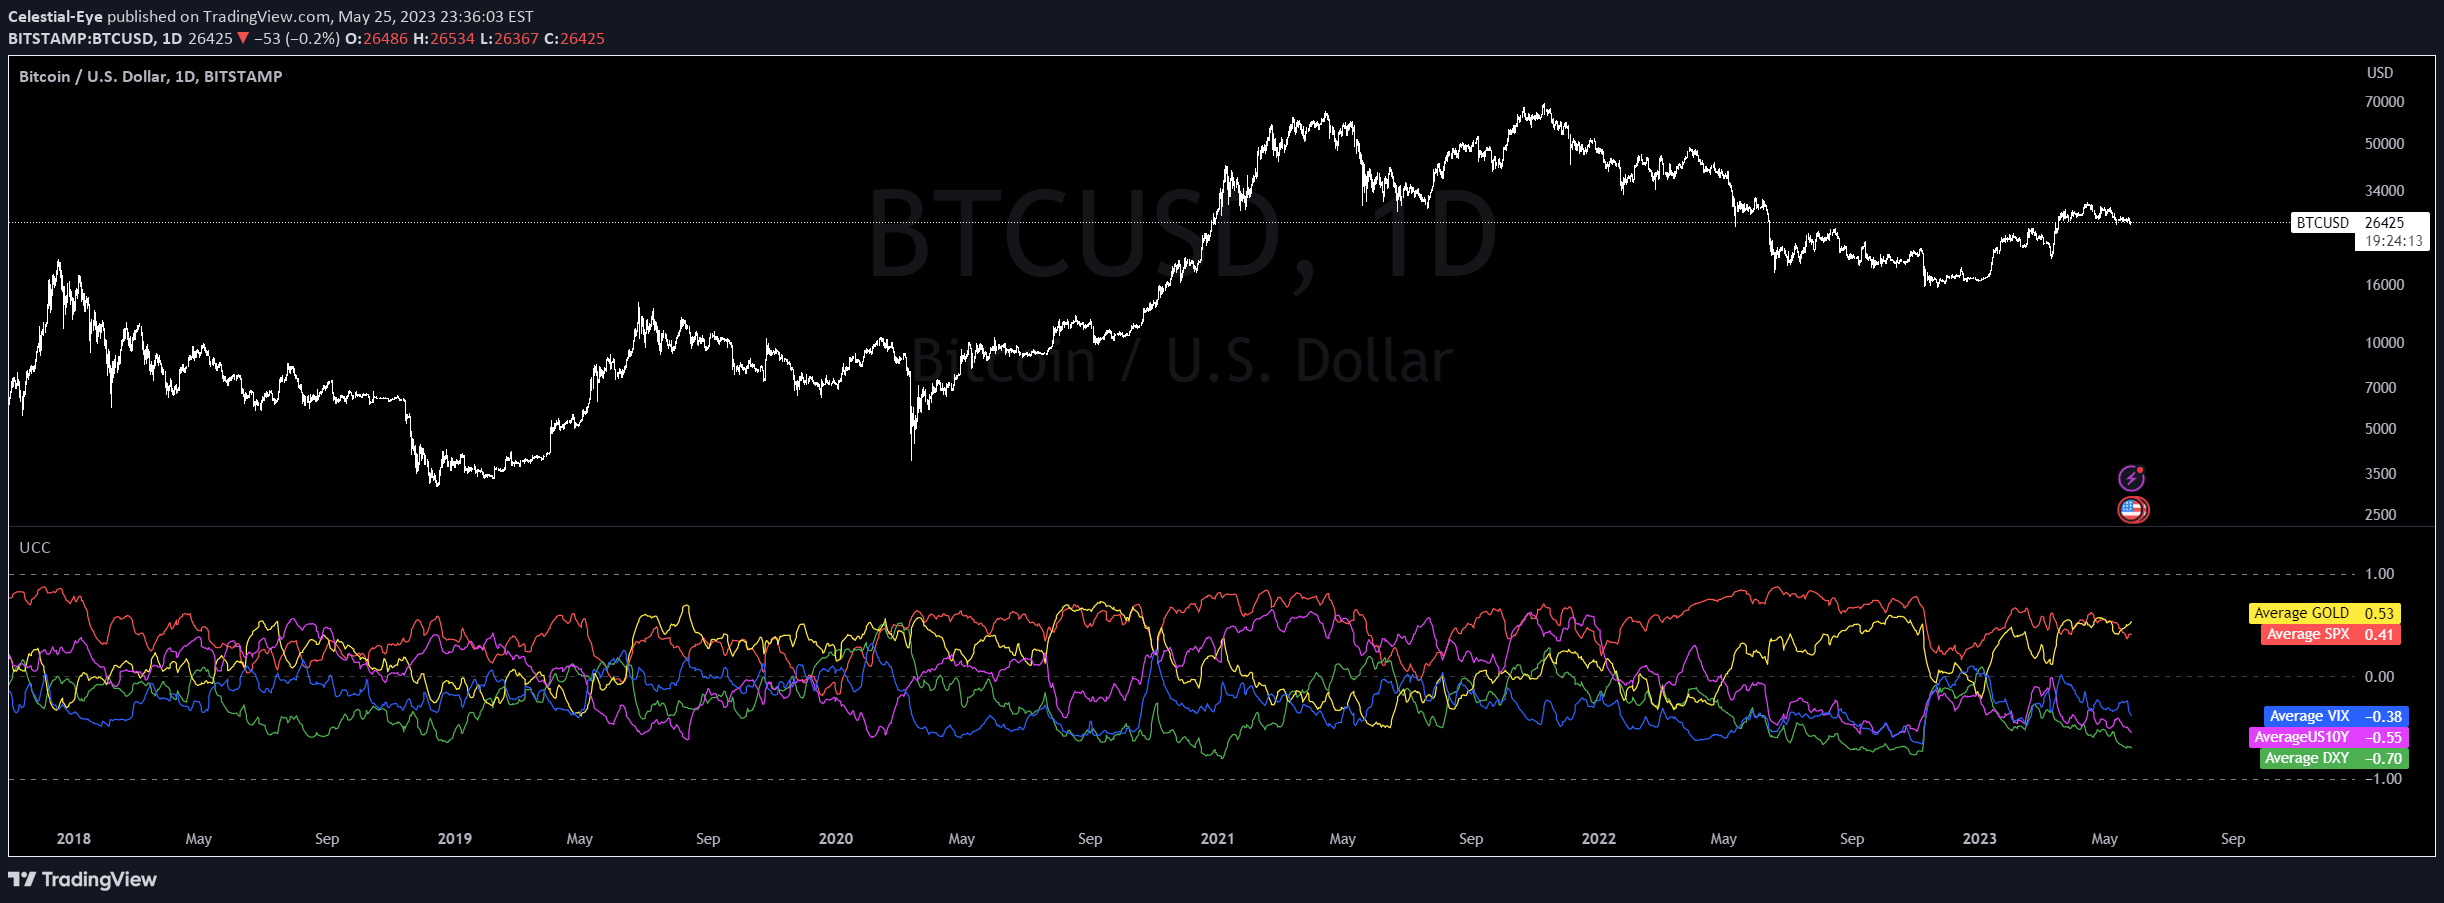
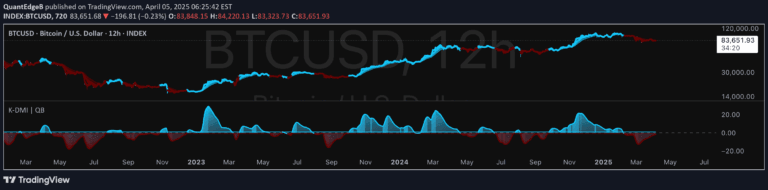
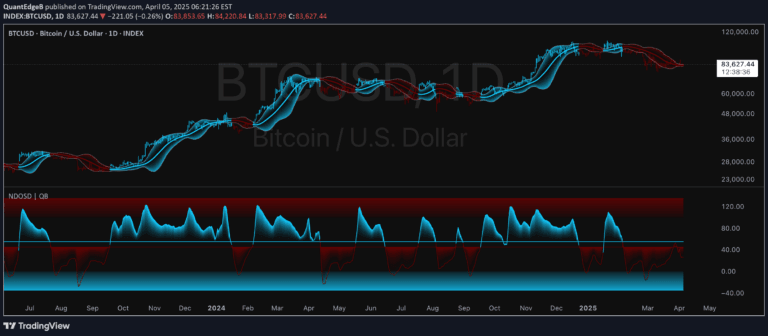
A statistical method measuring shared information between two asset prices, revealing potential correlations and relationships through mutual information calculation over a specified lookback period.
Explore complementary indicator rolesHow it works
Mutual Information (MI) quantifies the statistical dependency between two assets' closing prices by analyzing their shared information content. The script calculates MI by discretizing price data into predefined bins, which allows for a flexible, non-linear comparison of price movements.
By transforming continuous price data into discrete intervals, the algorithm measures how much information one asset's price movement provides about another asset's price behavior. The calculation involves comparing the joint probability distribution of the two assets against their individual probability distributions to determine the extent of their statistical relationship.
Why it may be useful
Mutual Information provides traders with a sophisticated method to understand complex, non-linear relationships between different financial assets that traditional correlation measures might miss. This approach can reveal hidden interdependencies that could be valuable for portfolio diversification, risk management, and identifying potential trading opportunities.
Unlike linear correlation methods, MI can capture more nuanced connections between assets, helping traders gain deeper insights into market dynamics. By quantifying shared information, traders can develop more robust strategies that account for intricate market interactions beyond simple linear correlations.
When to explore it
Mutual Information is most effective when analyzing assets that might have complex, non-linear relationships, such as different stocks within the same sector, international market indices, or assets with potential indirect correlations. Traders should use this method when seeking to understand subtle market interdependencies that traditional correlation techniques might overlook.
The technique is particularly useful during periods of market complexity, such as during economic transitions, sector rotations, or when exploring potential hedging strategies. Traders should apply MI when they want to gain a more nuanced understanding of how different assets might influence each other's price movements.
Keep exploring
What we’ve verified
Access, alerts and repainting behaviour have not been independently verified for this indicator. Check the creator’s current publication and settings.
General descriptions and classifications are recovered research. Verified details above identify the specific checks we have completed. Check the creator’s current publication for later changes.